Tutorial: creazione di un cluster con un’attività Fargate utilizzando la CLI di Amazon ECS

Questo tutorial mostra come configurare un cluster e distribuire un servizio con attività che utilizzano il tipo di lancio Fargate.

Prerequisiti

Verifica i seguenti requisiti preliminari:

Fase 1: Crea il ruolo IAM per l’esecuzione dell’attività

L’agente del container Amazon ECS effettua chiamate all’API di AWS per tuo conto, pertanto richiede una policy e un ruolo IAM che consentano al servizio di stabilire che l’agente appartiene a te. Questo ruolo IAM viene definito un ruolo IAM di esecuzione delle attività. Se disponi già di un ruolo per l’esecuzione delle attività pronto per essere utilizzato, puoi ignorare questa fase. Per ulteriori informazioni, consulta Ruolo IAM per l’esecuzione di attività Amazon ECS.

Per creare il ruolo IAM per l’esecuzione delle attività utilizzando AWS CLI

  1. Crea un file denominato task-execution-assume-role.json con i seguenti contenuti:{ "Version": "2012-10-17", "Statement": [ { "Sid": "", "Effect": "Allow", "Principal": { "Service": "ecs-tasks.amazonaws.com" }, "Action": "sts:AssumeRole" } ] }
  2. Crea il ruolo per l’esecuzione delle attivitàaws iam --region us-west-2 create-role --role-name ecsTaskExecutionRole --assume-role-policy-document file://task-execution-assume-role.json
  3. Collega la policy relativa al ruolo per l’esecuzione delle attività:aws iam --region us-west-2 attach-role-policy --role-name ecsTaskExecutionRole --policy-arn arn:aws:iam::aws:policy/service-role/AmazonECSTaskExecutionRolePolicy

Fase 2: Configura la CLI di Amazon ECS

Per poter effettuare richieste API a tuo nome, la CLI di Amazon ECS necessita delle credenziali, che può estrarre da variabili di ambiente, da un profilo AWS o da un profilo Amazon ECS. Per ulteriori informazioni, consulta Configurazione della CLI di Amazon ECS.

Per creare una configurazione della CLI di Amazon ECS

  1. Crea una configurazione cluster, che definisce la regione AWS, i prefissi di creazione delle risorse e il nome del cluster da utilizzare con la CLI di Amazon ECS:ecs-cli configure --cluster tutorial --default-launch-type FARGATE --config-name tutorial --region us-west-2
  2. Crea un profilo CLI utilizzando l’ID chiave di accesso e la chiave segreta:ecs-cli configure profile --access-key AWS_ACCESS_KEY_ID --secret-key AWS_SECRET_ACCESS_KEY --profile-name tutorial-profile

Fase 3: creare un cluster e configurare il gruppo di sicurezza

Per creare un cluster ECS e un gruppo di sicurezza

  1. Creare un cluster Amazon ECS con il comando ecs-cli up. Poiché nella configurazione del cluster hai specificato Fargate come tipo di lancio predefinito, il comando crea un cluster vuoto e un VPC configurato con due sottoreti pubbliche.ecs-cli up --cluster-config tutorial --ecs-profile tutorial-profilePossono essere necessari alcuni minuti perché le risorse vengano create e il comando venga completato. L’output di questo comando contiene gli ID di sottorete e i VPC creati. Prendi nota di questi ID poiché verranno utilizzati in un secondo momento.
  2. Utilizzando l’AWS CLI, recupera l’ID del gruppo di sicurezza predefinito per il VPC. Utilizza l’ID VPC dell’output precedente:aws ec2 describe-security-groups --filters Name=vpc-id,Values=VPC_ID --region us-west-2L’output di questo comando contiene l’ID del gruppo di sicurezza, utilizzato nella fase successiva.
  3. Tramite l’AWS CLI, aggiungi una regola del gruppo di sicurezza per consentire l’accesso in entrata sulla porta 80:aws ec2 authorize-security-group-ingress --group-id security_group_id --protocol tcp --port 80 --cidr 0.0.0.0/0 --region us-west-2

Fase 4: Crea un file Compose

In questa fase dovrai generare un semplice file Docker Compose che crea un’applicazione Web PHP. Attualmente, la CLI di Amazon ECS supporta le versione 1, 2 e 3 della sintassi del file di Docker Compose. Questo tutorial utilizza Docker Compose v3.

Di seguito è riportato il file di Compose, che puoi denominare docker-compose.yml. Il container web espone la porta 80 per il traffico in entrata al server Web, oltre a configurare il posizionamento dei log di container nel gruppo di log CloudWatch creato in precedenza. Questa riportata è la best practice per le attività Fargate.

version: '3'
services:
  web:
    image: amazon/amazon-ecs-sample
    ports:
      - "80:80"
    logging:
      driver: awslogs
      options: 
        awslogs-group: tutorial
        awslogs-region: us-west-2
        awslogs-stream-prefix: web

Nota

Se il tuo account contiene già un gruppo di log CloudWatch Logs denominato tutorial nella regione us-west-2, scegli un nome univoco in modo che l’interfaccia a riga di comando ECS crei un nuovo gruppo di log per questo tutorial.

Oltre alle informazioni del file di Docker Compose, dovrai specificare alcuni parametri specifici di Amazon ECS necessari per il servizio. Utilizzando gli ID per VPC, sottorete e gruppo di sicurezza ottenuti nel passo precedente, crea un file denominato ecs-params.yml con il seguente contenuto:

version: 1
task_definition:
  task_execution_role: ecsTaskExecutionRole
  ecs_network_mode: awsvpc
  task_size:
    mem_limit: 0.5GB
    cpu_limit: 256
run_params:
  network_configuration:
    awsvpc_configuration:
      subnets:
        - "subnet ID 1"
        - "subnet ID 2"
      security_groups:
        - "security group ID"
      assign_public_ip: ENABLED

Fase 5: Distribuisci il file Compose a un cluster

Dopo aver creato il file Compose, puoi distribuirlo al cluster con il comando ecs-cli compose service up. Per impostazione predefinita, il comando cerca i file denominati docker-compose.yml ed ecs-params.yml nella directory corrente; puoi specificare un altro file di Docker Compose con l’opzione --file e un altro file ECS Params con l’opzione --ecs-params. Per impostazione predefinita, le risorse create da questo comando contengono la directory corrente nel titolo, ma puoi sostituire questo valore con l’opzione --project-name. L’opzione --create-log-groups crea i gruppi di log CloudWatch per i log di container.

ecs-cli compose --project-name tutorial service up --create-log-groups --cluster-config tutorial --ecs-profile tutorial-profile

Fase 6: Visualizza i container in esecuzione su un cluster

Dopo aver distribuito il file Compose, puoi visualizzare i container in esecuzione nel servizio con il comando ecs-cli compose service ps.

ecs-cli compose --project-name tutorial service ps --cluster-config tutorial --ecs-profile tutorial-profile

Output:

Name                                           State    Ports                     TaskDefinition  Health
tutorial/0c2862e6e39e4eff92ca3e4f843c5b9a/web  RUNNING  34.222.202.55:80->80/tcp  tutorial:1      UNKNOWN

Nell’esempio precedente, dal file Compose puoi visualizzare sia il container web, sia l’indirizzo IP e la porta del server Web. Se il browser Web fa riferimento a tale indirizzo, viene visualizzata l’applicazione Web PHP. Nell’output è riportato anche il valore task-id del container. Copia l’ID attività, che ti servirà nella fase successiva.

Fase 7: Visualizza i log di container

Visualizza i log per l’attività:

ecs-cli logs --task-id 0c2862e6e39e4eff92ca3e4f843c5b9a --follow --cluster-config tutorial --ecs-profile tutorial-profile

Nota

L’opzione --follow indica alla CLI di Amazon ECS di eseguire continuamente il polling per i log.

Fase 8: Dimensiona le attività sul cluster

Con il comando ecs-cli compose service scale puoi ampliare il numero di attività per aumentare il numero di istanze dell’applicazione. In questo esempio, il conteggio in esecuzione dell’applicazione viene portato a due.

ecs-cli compose --project-name tutorial service scale 2 --cluster-config tutorial --ecs-profile tutorial-profile

Ora nel cluster saranno presenti due container in più:

ecs-cli compose --project-name tutorial service ps --cluster-config tutorial --ecs-profile tutorial-profile

Output:

Name                                           State    Ports                      TaskDefinition  Health
tutorial/0c2862e6e39e4eff92ca3e4f843c5b9a/web  RUNNING  34.222.202.55:80->80/tcp   tutorial:1      UNKNOWN
tutorial/d9fbbc931d2e47ae928fcf433041648f/web  RUNNING  34.220.230.191:80->80/tcp  tutorial:1      UNKNOWN

Fase 9: visualizzare l’applicazione Web

Inserisci l’indirizzo IP dell’attività nel browser Web per visualizzare una pagina Web contenente l’applicazione Web Simple PHP App (App PHP semplice).

Fase 10: Elimina

Al termine di questo tutorial, dovrai eliminare le risorse in modo che non comportino ulteriori addebiti. Per prima cosa, elimina il servizio: in questo modo i container esistenti verranno interrotti e non tenteranno di eseguire altre attività.

ecs-cli compose --project-name tutorial service down --cluster-config tutorial --ecs-profile tutorial-profile

Ora arresta il cluster per eliminare le risorse create in precedenza con il comando ecs-cli up.

ecs-cli down --force --cluster-config tutorial --ecs-profile tutorial-profile

Ready-to-use commands and tips for kubectl

Image for post

Kubectl is the most important Kubernetes command-line tool that allows you to run commands against clusters. We at Flant internally share our knowledge of using it via formal wiki-like instructions as well as Slack messages (we also have a handy and smart search engine in place — but that’s a whole different story…). Over the years, we have accumulated a large number of various kubectl tips and tricks. Now, we’ve decided to share some of our cheat sheets with a wider community.

I am sure our readers might be familiar with many of them. But still, I hope you will learn something new and, thereby, improve your productivity.

NB: While some of the commands & techniques listed below were compiled by our engineers, others were found on the Web. In the latter case, we checked them thoroughly and found them useful.

Well, let’s get started!

Getting lists of pods and nodes

1. I guess you are all aware of how to get a list of pods across all Kubernetes namespaces using the --all-namespaces flag. Many people are so used to it that they have not noticed the emergence of its shorter version, -A (it exists since at least Kubernetes 1.15).

2. How do you find all non-running pods (i.e., with a state other than Running)?

kubectl get pods -A --field-selector=status.phase!=Running | grep -v Complete
Image for post

By the way, examining the --field-selector flag more closely (see the relevant documentation) might be a good general recommendation.

3. Here is how you can get the list of nodes and their memory size:

kubectl get no -o json | \
jq -r '.items | sort_by(.status.capacity.memory)[]|[.metadata.name,.status.capacity.memory]| @tsv'
Image for post

4. Getting the list of nodes and the number of pods running on them:

kubectl get po -o json --all-namespaces | \
jq '.items | group_by(.spec.nodeName) | map({"nodeName": .[0].spec.nodeName, "count": length}) | sort_by(.count)'
Image for post

5. Sometimes, DaemonSet does not schedule a pod on a node for whatever reason. Manually searching for them is a tedious task, so here is a mini-script to get a list of such nodes:

ns=my-namespace
pod_template=my-pod
kubectl get node | grep -v \"$(kubectl -n ${ns} get pod --all-namespaces -o wide | fgrep ${pod_template} | awk '{print $8}' | xargs -n 1 echo -n "\|" | sed 's/[[:space:]]*//g')\"

6. This is how you can use kubectl top to get a list of pods that eat up CPU and memory resources:

# cpu
kubectl top pods -A | sort --reverse --key 3 --numeric
# memory
kubectl top pods -A | sort --reverse --key 4 --numeric

7. Sorting the list of pods (in this case, by the number of restarts):

kubectl get pods --sort-by=.status.containerStatuses[0].restartCount
Image for post

Of course, you can sort them by other fields, too (see PodStatus and ContainerStatus for details).

Getting other data

1. When tuning the Ingress resource, we inevitably go down to the service itself and then search for pods based on its selector. I used to look for this selector in the service manifest, but later switched to the -o wide flag:

kubectl -n jaeger get svc -o wide
NAME TYPE CLUSTER-IP EXTERNAL-IP PORT(S) AGE SELECTORjaeger-cassandra ClusterIP None <none> 9042/TCP 77d app=cassandracluster,cassandracluster=jaeger-cassandra,cluster=jaeger-cassandra

As you can see, in this case, we get the selector used by our service to find the appropriate pods.

2. Here is how you can easily print limits and requests of each pod:

kubectl get pods -n my-namespace -o=custom-columns='NAME:spec.containers[*].name,MEMREQ:spec.containers[*].resources.requests.memory,MEMLIM:spec.containers[*].resources.limits.memory,CPUREQ:spec.containers[*].resources.requests.cpu,CPULIM:spec.containers[*].resources.limits.cpu'
Image for post

3. The kubectl run command (as well as createapplypatch) has a great feature that allows you to see the expected changes without actually applying them — the --dry-run flag. When it is used with -o yaml, this command outputs the manifest of the required object. For example:

kubectl run test --image=grafana/grafana --dry-run -o yamlapiVersion: apps/v1
kind: Deployment
metadata:
creationTimestamp: null
labels:
run: test
name: test
spec:
replicas: 1
selector:
matchLabels:
run: test
strategy: {}
template:
metadata:
creationTimestamp: null
labels:
run: test
spec:
containers:
- image: grafana/grafana
name: test
resources: {}
status: {}

All you have to do now is to save it to a file, delete a couple of system/unnecessary fields, et voila.

NB: Please note that the kubectl run behavior has been changed in Kubernetes v1.18 (now, it generates Pods instead of Deployments). You can find a great summary on this issue here.

4. Getting a description of the manifest of a given resource:

kubectl explain hpaKIND:     HorizontalPodAutoscaler
VERSION: autoscaling/v1DESCRIPTION:
configuration of a horizontal pod autoscaler.FIELDS:
apiVersion <string>
APIVersion defines the versioned schema of this representation of an
object. Servers should convert recognized schemas to the latest internal
value, and may reject unrecognized values. More info:
https://git.k8s.io/community/contributors/devel/api-conventions.md#resourceskind <string>
Kind is a string value representing the REST resource this object
represents. Servers may infer this from the endpoint the client submits
requests to. Cannot be updated. In CamelCase. More info:
https://git.k8s.io/community/contributors/devel/api-conventions.md#types-kindsmetadata <Object>
Standard object metadata. More info:
https://git.k8s.io/community/contributors/devel/api-conventions.md#metadataspec <Object>
behaviour of autoscaler. More info:
https://git.k8s.io/community/contributors/devel/api-conventions.md#spec-and-status.status <Object>
current information about the autoscaler.

Well, that is a piece of extensive and very helpful information, I must say.

Networking

1. Here is how you can get internal IP addresses of cluster nodes:

kubectl get nodes -o json | \
jq -r '.items[].status.addresses[]? | select (.type == "InternalIP") | .address' | \
paste -sd "\n" -
Image for post

2. And this way, you can print all services and their respective nodePorts:

kubectl get --all-namespaces svc -o json | \
jq -r '.items[] | [.metadata.name,([.spec.ports[].nodePort | tostring ] | join("|"))]| @tsv'

3. In situations where there are problems with the CNI (for example, with Flannel), you have to check the routes to identify the problem pod. Pod subnets that are used in the cluster can be very helpful in this task:

kubectl get nodes -o jsonpath='{.items[*].spec.podCIDR}' | tr " " "\n"
Image for post

Logs

1. Print logs with a human-readable timestamp (if it is not set):

kubectl -n my-namespace logs -f my-pod --timestamps2020-07-08T14:01:59.581788788Z fail: Microsoft.EntityFrameworkCore.Query[10100]

Logs look so much better now, don’t they?

2. You do not have to wait until the entire log of the pod’s container is printed out — just use --tail:

kubectl -n my-namespace logs -f my-pod --tail=50

3. Here is how you can print all the logs from all containers of a pod:

kubectl -n my-namespace logs -f my-pod --all-containers

4. Getting logs from all pods using a label to filter:

kubectl -n my-namespace logs -f -l app=nginx

5. Getting logs of the “previous” container (for example, if it has crashed):

kubectl -n my-namespace logs my-pod --previous

Other quick actions

1. Here is how you can quickly copy secrets from one namespace to another:

kubectl get secrets -o json --namespace namespace-old | \
jq '.items[].metadata.namespace = "namespace-new"' | \
kubectl create-f -

2. Run these two commands to create a self-signed certificate for testing:

openssl req -x509 -nodes -days 365 -newkey rsa:2048 -keyout tls.key -out tls.crt -subj "/CN=grafana.mysite.ru/O=MyOrganization"
kubectl -n myapp create secret tls selfsecret --key tls.key --cert tls.crt

Helpful links on the topic

In lieu of conclusion — here is a small list of similar publications and cheat sheets’ collections we’ve found online:

Image for post

Deploying WordPress and MySQL with Persistent Volumes in Kubernetes

This tutorial shows you how to deploy a WordPress site and a MySQL database using Minikube. Both applications use PersistentVolumes and PersistentVolumeClaims to store data.

PersistentVolume (PV) is a piece of storage in the cluster that has been manually provisioned by an administrator, or dynamically provisioned by Kubernetes using a StorageClass. A PersistentVolumeClaim (PVC) is a request for storage by a user that can be fulfilled by a PV. PersistentVolumes and PersistentVolumeClaims are independent from Pod lifecycles and preserve data through restarting, rescheduling, and even deleting Pods.Warning: This deployment is not suitable for production use cases, as it uses single instance WordPress and MySQL Pods. Consider using WordPress Helm Chart to deploy WordPress in production.Note: The files provided in this tutorial are using GA Deployment APIs and are specific to kubernetes version 1.9 and later. If you wish to use this tutorial with an earlier version of Kubernetes, please update the API version appropriately, or reference earlier versions of this tutorial.

Objectives

  • Create PersistentVolumeClaims and PersistentVolumes
  • Create a kustomization.yaml with
    • a Secret generator
    • MySQL resource configs
    • WordPress resource configs
  • Apply the kustomization directory by kubectl apply -k ./
  • Clean up

Before you begin

You need to have a Kubernetes cluster, and the kubectl command-line tool must be configured to communicate with your cluster. If you do not already have a cluster, you can create one by using Minikube, or you can use one of these Kubernetes playgrounds:

To check the version, enter kubectl version. The example shown on this page works with kubectl 1.14 and above.

Download the following configuration files:

  1. mysql-deployment.yaml
  2. wordpress-deployment.yaml

Create PersistentVolumeClaims and PersistentVolumes

MySQL and WordPress each require a PersistentVolume to store data. Their PersistentVolumeClaims will be created at the deployment step.

Many cluster environments have a default StorageClass installed. When a StorageClass is not specified in the PersistentVolumeClaim, the cluster’s default StorageClass is used instead.

When a PersistentVolumeClaim is created, a PersistentVolume is dynamically provisioned based on the StorageClass configuration.Warning: In local clusters, the default StorageClass uses the hostPath provisioner. hostPath volumes are only suitable for development and testing. With hostPath volumes, your data lives in /tmp on the node the Pod is scheduled onto and does not move between nodes. If a Pod dies and gets scheduled to another node in the cluster, or the node is rebooted, the data is lost.Note: If you are bringing up a cluster that needs to use the hostPath provisioner, the --enable-hostpath-provisioner flag must be set in the controller-manager component.Note: If you have a Kubernetes cluster running on Google Kubernetes Engine, please follow this guide.

Create a kustomization.yaml

Add a Secret generator

Secret is an object that stores a piece of sensitive data like a password or key. Since 1.14, kubectl supports the management of Kubernetes objects using a kustomization file. You can create a Secret by generators in kustomization.yaml.

Add a Secret generator in kustomization.yaml from the following command. You will need to replace YOUR_PASSWORD with the password you want to use.

cat <<EOF >./kustomization.yaml
secretGenerator:
- name: mysql-pass
  literals:
  - password=YOUR_PASSWORD
EOF

Add resource configs for MySQL and WordPress

The following manifest describes a single-instance MySQL Deployment. The MySQL container mounts the PersistentVolume at /var/lib/mysql. The MYSQL_ROOT_PASSWORD environment variable sets the database password from the Secret.

application/wordpress/mysql-deployment.yaml 
apiVersion: v1 kind: Service metadata: name: wordpress labels: app: wordpress spec: ports: - port: 80 selector: app: wordpress tier: frontend type: LoadBalancer --- apiVersion: v1 kind: PersistentVolumeClaim metadata: name: wp-pv-claim labels: app: wordpress spec: accessModes: - ReadWriteOnce resources: requests: storage: 20Gi --- apiVersion: apps/v1 # for versions before 1.9.0 use apps/v1beta2 kind: Deployment metadata: name: wordpress labels: app: wordpress spec: selector: matchLabels: app: wordpress tier: frontend strategy: type: Recreate template: metadata: labels: app: wordpress tier: frontend spec: containers: - image: wordpress:4.8-apache name: wordpress env: - name: WORDPRESS_DB_HOST value: wordpress-mysql - name: WORDPRESS_DB_PASSWORD valueFrom: secretKeyRef: name: mysql-pass key: password ports: - containerPort: 80 name: wordpress volumeMounts: - name: wordpress-persistent-storage mountPath: /var/www/html volumes: - name: wordpress-persistent-storage persistentVolumeClaim: claimName: wp-pv-claim

The following manifest describes a single-instance WordPress Deployment. The WordPress container mounts the PersistentVolume at /var/www/html for website data files. The WORDPRESS_DB_HOST environment variable sets the name of the MySQL Service defined above, and WordPress will access the database by Service. The WORDPRESS_DB_PASSWORD environment variable sets the database password from the Secret kustomize generated.

application/wordpress/wordpress-deployment.yaml 
apiVersion: v1 kind: Service metadata: name: wordpress labels: app: wordpress spec: ports: - port: 80 selector: app: wordpress tier: frontend type: LoadBalancer --- apiVersion: v1 kind: PersistentVolumeClaim metadata: name: wp-pv-claim labels: app: wordpress spec: accessModes: - ReadWriteOnce resources: requests: storage: 20Gi --- apiVersion: apps/v1 # for versions before 1.9.0 use apps/v1beta2 kind: Deployment metadata: name: wordpress labels: app: wordpress spec: selector: matchLabels: app: wordpress tier: frontend strategy: type: Recreate template: metadata: labels: app: wordpress tier: frontend spec: containers: - image: wordpress:4.8-apache name: wordpress env: - name: WORDPRESS_DB_HOST value: wordpress-mysql - name: WORDPRESS_DB_PASSWORD valueFrom: secretKeyRef: name: mysql-pass key: password ports: - containerPort: 80 name: wordpress volumeMounts: - name: wordpress-persistent-storage mountPath: /var/www/html volumes: - name: wordpress-persistent-storage persistentVolumeClaim: claimName: wp-pv-claim
  1. Download the MySQL deployment configuration file.curl -LO https://k8s.io/examples/application/wordpress/mysql-deployment.yaml
  2. Download the WordPress configuration file.curl -LO https://k8s.io/examples/application/wordpress/wordpress-deployment.yaml
  3. Add them to kustomization.yaml file.
cat <<EOF >>./kustomization.yaml
resources:
  - mysql-deployment.yaml
  - wordpress-deployment.yaml
EOF

Apply and Verify

The kustomization.yaml contains all the resources for deploying a WordPress site and a MySQL database. You can apply the directory by

kubectl apply -k ./

Now you can verify that all objects exist.

  1. Verify that the Secret exists by running the following command:kubectl get secrets The response should be like this:NAME TYPE DATA AGE mysql-pass-c57bb4t7mf Opaque 1 9s
  2. Verify that a PersistentVolume got dynamically provisioned.kubectl get pvc Note: It can take up to a few minutes for the PVs to be provisioned and bound.The response should be like this:NAME STATUS VOLUME CAPACITY ACCESS MODES STORAGECLASS AGE mysql-pv-claim Bound pvc-8cbd7b2e-4044-11e9-b2bb-42010a800002 20Gi RWO standard 77s wp-pv-claim Bound pvc-8cd0df54-4044-11e9-b2bb-42010a800002 20Gi RWO standard 77s
  3. Verify that the Pod is running by running the following command:kubectl get pods Note: It can take up to a few minutes for the Pod’s Status to be RUNNING.The response should be like this:NAME READY STATUS RESTARTS AGE wordpress-mysql-1894417608-x5dzt 1/1 Running 0 40s
  4. Verify that the Service is running by running the following command:kubectl get services wordpress The response should be like this:NAME TYPE CLUSTER-IP EXTERNAL-IP PORT(S) AGE wordpress LoadBalancer 10.0.0.89 <pending> 80:32406/TCP 4m Note: Minikube can only expose Services through NodePort. The EXTERNAL-IP is always pending.
  5. Run the following command to get the IP Address for the WordPress Service:minikube service wordpress --url The response should be like this:http://1.2.3.4:32406
  6. Copy the IP address, and load the page in your browser to view your site.You should see the WordPress set up page similar to the following screenshot.wordpress-init

Warning: Do not leave your WordPress installation on this page. If another user finds it, they can set up a website on your instance and use it to serve malicious content.

Either install WordPress by creating a username and password or delete your instance.

Cleaning up

  1. Run the following command to delete your Secret, Deployments, Services and PersistentVolumeClaims:kubectl delete -k ./

What’s next

What is CI/CD

Our space is about mobile CI/CD but, let’s start with the basics in this article before going into the details of why mobile CI/CD is actually different than other CI/CD flows in our future articles.

Image for post

What is Continuous Integration?

Continuous Integration (CI) is the building process for every code pushed to a repository automatically.

This is of course a very simplified definition and CI contains a number of different components, which are like the building blocks that come together to become a workflow.

A CI workflow may include operations like compiling the app, static code reviews and unit/UI testing with automated tools.

There are a number of different tools for CI/CD, some of the most popular ones are Jenkins, Travis and CircleCI, but mobile CI/CD requires specialization and in our space, we will be talking more about mobile CI/CD tools like Appcircle and Bitrise.


What is Continuous Delivery (or Deployment)?

Continuous Delivery (CD) is the delivery of the application for use with the components like the generation of environment-specific versions, codesigning, version management and deployment to a certain provider.

For mobile apps, the deployment can be done to a testing platform like TestFlight (for end user testing on actual devices) or Appcircle (for actual or virtual device testing).

Similarly, the release version of the app can be deployed to App Store and Google Play for B2C apps or to an enterprise app store for B2E apps.


Finally, what is a CI and CD pipeline?

With all CI/CD components are in place and connected together in an automated manner, they form an application pipeline. You just push your code and the code is processed through the pipeline.

CI is mainly responsible for processing the contents of the pipeline and CD is mainly responsible for directing the contents of the pipeline in the right direction.

In a well-functioning application pipeline, you don’t see the actual contents, it just flows by itself, but you have a full visibility on what is flowing and to where just like an actual pipeline.

Demystifying Containers – Part II: Container Runtimes

This second blog post (and talk) is primary scoped to container runtimes, where we will start with their historic origins before digging deeper into two dedicated projects: runc and CRI-O. We will initially build up a great foundation about how container runtimes work under the hood by starting with the lower level runtime runc. Afterwards, we will utilize the more advanced runtime CRI-O to run Kubernetes native workloads, but without even running Kubernetes at all.

Introduction

In the previous part of this series we discussed Linux Kernel Namespaces and everything around to build up a foundation about containers and their basic isolation techniques. Now we want to dive deeper into answering the question: “How to actually run containers?”. We will do so without being overwhelmed by the details of Kubernetes’ features or security related topics, which will be part of further blog posts and talks.

What is a Container Runtime?

Applications and their required or not required use cases are contentiously discussed topics in the UNIX world. The mainUNIX philosophy propagates minimalism and modular software parts which should fit well together in a complete system. Great examples which follow these philosophical aspects are features like the UNIX pipe or text editors like vim. These tools solve one dedicated task as best as they can and are tremendously successful at it. On the other side, there are projects like systemd or cmake, which do not follow the same approach and implement a richer feature set over time. In the end we have multiple views and opinions about answers to questions like ”How should an initialization system look like?” or ”What should a build system do?”. If these multi-opinionated views mix up with historical events, then answering a simple question might need more explanations than it should.

Now, welcome to the world of containers!

Lots of applications can run containers, whereas every application would have a sightly different opinion about what a container runtime should do and support. For example, systemd is able to run containers via systemd-nspawn, and NixOS has integrated container management as well. Not to mention all the other existing container runtimes like CRI-OKata ContainersFirecrackergVisorcontainerdLXCruncNabla Containers and many more. A lot of them are now part of theCloud Native Computing Foundation (CNCF) and their huge landscape, whereas someone might ask: ”Why do so many container runtimes exist?”.

Per usual for our series of blog posts, we should start from the historical beginning.

A Brief History

After the invention of cgroups back in 2008, a project called Linux Containers (LXC) started to pop-up in the wild, which should revolutionize the container world. LXC combined cgroup and namespace technologies to provide an isolated environment for running applications. You may know that we sometimes live in a parallel world. This means that Google started their own containerization project in 2007 called Let Me Contain That For You (LMCTFY), which works mainly at the same level as LXC does. With LMCTFY, Google tried to provide a stable and API driven configuration without users having to understand the details of cgroups and its internals.

If we now look back into 2013 we see that there was a tool written called Docker, which was built on top of the already existing LXC stack. One invention of Docker was that the user is now able to package containers into images to move them between machines. Docker were the fist ones who tried to make containers a standard software unit, as they state in their ”Standard Container Manifesto”.

Some years later they began to work on libcontainer, a Go native way to spawn and manage containers. LMCTFY was abandoned during that time too, whereas the core concepts and major benefits of LMCTFY were ported into libcontainer and Docker.

We are now back in 2015, where projects like Kubernetes hit version 1.0. A lot of stuff was ongoing during that time: The CNCF was founded as part of the Linux Foundation with the target to promote containers. The Open Container Initiative (OCI)was founded 2015 as well, as an open governance structure around the container ecosystem.

Their main target is to create open industry standards around container formats and runtimes. We were now in a state where containers are used, in terms of their popularity, side by side with classic Virtual Machines (VMs). There was a need for a specification of how containers should run, which resulted in the OCI Runtime Specification. Runtime developers should now be able to have a well-defined API to develop their container runtime. The libcontainer project was donated to the OCI during that time, whereas a new tool called runc was born as part of that. With runc it was now possible to directly interact with libcontainer, interpret the OCI Runtime Specification and run containers from it.

As of today, runc is one of the most popular projects in the container ecosystem and is used in a lot of other projects like containerd (used by Docker), CRI-O and podman. Other projects adopted the OCI Runtime Specification as well. For example Kata Containers makes it possible to build and run secure containers including lightweight virtual machines that feel and perform like containers, but provide stronger workload isolation using hardware virtualization technology as a second layer of defense.

Let’s dig more into the OCI Runtime Specification to get a better understanding about how a container runtime works under the hood.

Running Containers

runc

The OCI Runtime Specification provides information about the configuration, execution environment and overall life cycle of a container. A configuration is mainly a JSON file that contains all necessary information to enable the creation of a container on different target platforms like Linux, Windows or Virtual Machines (VMs).

An example specification can be easily generated with runc:

> runc spec
> cat config.json
{
  "ociVersion": "1.0.0",
  "process": {
    "terminal": true,
    "user": { "uid": 0, "gid": 0 },
    "args": ["sh"],
    "env": [
      "PATH=/usr/local/sbin:/usr/local/bin:/usr/sbin:/usr/bin:/sbin:/bin",
      "TERM=xterm"
    ],
    "cwd": "/",
    "capabilities": {
      "bounding": ["CAP_AUDIT_WRITE", "CAP_KILL", "CAP_NET_BIND_SERVICE"],
      [...]
    },
    "rlimits": [ { "type": "RLIMIT_NOFILE", "hard": 1024, "soft": 1024 } ],
    "noNewPrivileges": true
  },
  "root": { "path": "rootfs", "readonly": true },
  "hostname": "runc",
  "mounts": [
    {
      "destination": "/proc",
      "type": "proc",
      "source": "proc"
    },
    [...]
  ],
  "linux": {
    "resources": { "devices": [ { "allow": false, "access": "rwm" } ] },
    "namespaces": [
      { "type": "pid" },
      { "type": "network" },
      { "type": "ipc" },
      { "type": "uts" },
      { "type": "mount" }
    ],
    "maskedPaths": [
      "/proc/kcore",
      [...]
    ],
    "readonlyPaths": [
      "/proc/asound",
      [...]
    ]
  }
}

This file mainly contains all necessary information for runc to get started with running containers. For example, we have attributes about the running process, the defined environment variables, the user and group IDs, needed mount points and the Linux namespaces to be set up. One thing is still missing to get started running containers: We need an appropriate root file-system (rootfs). We already discovered in the past blog post how to obtain it from an already existing container image:

> skopeo copy docker://opensuse/tumbleweed:latest oci:tumbleweed:latest
[output removed]
> sudo umoci unpack --image tumbleweed:latest bundle
[output removed]

Interestingly, the unpacked container image already includes the Runtime Specification we need to run the bundle:

> sudo chown -R $(id -u) bundle
> cat bundle/config.json
{
  "ociVersion": "1.0.0",
  "process": {
    "terminal": true,
    "user": { "uid": 0, "gid": 0 },
    "args": ["/bin/bash"],
    "env": [
      "PATH=/usr/local/sbin:/usr/local/bin:/usr/sbin:/usr/bin:/sbin:/bin",
      "TERM=xterm",
      "HOME=/root"
    ],
    "cwd": "/",
    "capabilities": { [...] },
    "rlimits": [...]
  },
  "root": { "path": "rootfs" },
  "hostname": "mrsdalloway",
  "mounts": [...],
  "annotations": {
    "org.opencontainers.image.title": "openSUSE Tumbleweed Base Container",
    "org.opencontainers.image.url": "https://www.opensuse.org/",
    "org.opencontainers.image.vendor": "openSUSE Project",
    "org.opencontainers.image.version": "20190517.6.190",
    [...]
  },
  "linux": {
    "resources": { "devices": [ { "allow": false, "access": "rwm" } ] },
    "namespaces": [
      { "type": "pid" },
      { "type": "network" },
      { "type": "ipc" },
      { "type": "uts" },
      { "type": "mount" }
    ]
  }
}

There are now some annotations included beside the usual fields we already know from running runc spec. These can be used to add arbitrary metadata to the container, which can be utilized by higher level runtimes to add additional information to the specification.

Let’s create a new container from the bundle with runc. Before actually calling out to runc, we have to setup a receiver terminal to be able to interact with the container. For this, we can use the recvtty tool included in the runc repository:

> go get github.com/opencontainers/runc/contrib/cmd/recvtty
> recvtty tty.sock

In another terminal, we now call runc create with specifying the bundle and terminal socket:

> sudo runc create -b bundle --console-socket $(pwd)/tty.sock container

No further output, so what happened now? It seems like we have created a new container in created state:

> sudo runc list
ID          PID         STATUS      BUNDLE      CREATED                          OWNER
container   29772       created     /bundle     2019-05-21T08:35:51.382141418Z   root

The container seems to be not running, but what is running inside?

> sudo runc ps container
UID        PID  PPID  C STIME TTY          TIME CMD
root     29772     1  0 10:35 ?        00:00:00 runc init

The runc init command sets up a fresh environment with all necessary namespaces and launches a new initial process. The main process /bin/bash does not run yet inside the container, but we are still able to execute further processes within the container:

> sudo runc exec -t container echo "Hello, world!"
> Hello, world!

The created state of a container provides a nice environment to setup networking for example. To actually do something within the container, we have to bring it into the running state. This can be done via runc start:

> sudo runc start container

In the terminal where the recvtty process is running, a new bash shell session should now pop up:

mrsdalloway:/ $
mrsdalloway:/ $ ps aux
ps aux
USER       PID %CPU %MEM    VSZ   RSS TTY      STAT START   TIME COMMAND
root         1  0.0  0.0   5156  4504 pts/0    Ss   10:28   0:00 /bin/bash
root        29  0.0  0.0   6528  3372 pts/0    R+   10:32   0:00 ps aux

Nice, the container seems to be running. We can now utilize runc to inspect the container’s state:

> sudo runc list
ID          PID         STATUS      BUNDLE      CREATED                          OWNER
container   4985        running     /bundle     2019-05-20T12:14:14.232015447Z   root
> sudo runc ps container
UID        PID  PPID  C STIME TTY          TIME CMD
root      6521  6511  0 14:25 pts/0    00:00:00 /bin/bash

The runc init process has gone and now only the actual /bin/bash process exists within the container. We can also do some basic life cycle management with the container:

> sudo runc pause container

It should now be impossible to get any output from the running container in the recvtty session. To resume the container, simply call:

> sudo runc resume container

Everything we tried to type before should now pop up in the resumed container terminal. If we need more information about the container, like the CPU and memory usage, then we can retrieve them via the runc events API:

> sudo runc events container
{...}

The output is a bit hard to read, so let’s reformat it and strip some fields:

{
  "type": "stats",
  "id": "container",
  "data": {
    "cpu": {
      "usage": {
        "total": 31442016,
        "percpu": [ 5133429, 5848165, 827530, ... ],
        "kernel": 20000000,
        "user": 0
      },
      "throttling": {}
    },
    "memory": {
      "usage": {
        "limit": 9223372036854771712,
        "usage": 1875968,
        "max": 6500352,
        "failcnt": 0
      },
      "swap": { "limit": 0, "failcnt": 0 },
      "kernel": {
        "limit": 9223372036854771712,
        "usage": 311296,
        "max": 901120,
        "failcnt": 0
      },
      "kernelTCP": { "limit": 9223372036854771712, "failcnt": 0 },
      "raw": {
        "active_anon": 1564672,
        [...]
      }
    },
    "pids": { "current": 1 },
    "blkio": {},
    "hugetlb": { "1GB": { "failcnt": 0 }, "2MB": { "failcnt": 0 } },
    "intel_rdt": {}
  }
}

We can see that we are able to retrieve detailed runtime information about the container.

To stop the container, we simply exit the recvtty session. Afterwards the container can be removed with runc delete:

> sudo runc list
ID          PID         STATUS      BUNDLE      CREATED                         OWNER
container   0           stopped     /bundle     2019-05-21T10:28:32.765888075Z  root
> sudo runc delete container
> sudo runc list
ID          PID         STATUS      BUNDLE      CREATED     OWNER

Containers in the stopped state cannot run again, so they have to be recreated from a fresh state. As already mentioned, the extracted bundle contains the necessary config.json file beside the rootfs, which will be used by runc to setup the container. We could for example modify the initial run command of the container by executing:

> cd bundle
> jq '.process.args = ["echo", "Hello, world!"]' config.json | sponge config.json
> sudo runc run container
> Hello, world!

We have nearly every freedom by editing the rootfs or the config.json. So we could tear down the PID namespace isolation between the container and the host:

> jq '.process.args = ["ps", "a"] | del(.linux.namespaces[0])' config.json | sponge config.json
> sudo runc run container
16583 ?        S+     0:00 sudo runc run container
16584 ?        Sl+    0:00 runc run container
16594 pts/0    Rs+    0:00 ps a
[output truncated]

In the end runc is a pretty low level runtime, whereas improper configuration and usage can lead into serious security concerns. Truly, runc has native support for security enhancements like seccompSecurity-Enhanced Linux (SELinux) andAppArmor but these features should be used by higher level runtimes to ensure correct usage in production. It is also worth mentioning that it is possible to run containers in rootless mode via runc to security harden the deployment even further. We will cover these topics in future blog posts as well, but for now that should suffice on that level.

Another drawback in running containers only with runc would be that we have to manually set up the networking to the host to reach out to the internet or other containers. In order to do that we could use the Runtime Specification Hooks feature to set up a default bridge before actually starting the container.

But why don’t we leave this job to a higher level runtime as well? Let’s go for that and move on.

The Kubernetes Container Runtime Interface (CRI)

Back in 2016, the Kubernetes project announced the implementation of the Container Runtime Interface (CRI), which provides a standard API for container runtimes to work with Kubernetes. This interface enables users to exchange the runtime in a cluster with ease.

How does the API work? At the bottom line of every Kubernetes cluster runs a piece of software called the kubelet, which has the main job of keeping container workloads running and healthy. The kubelet connects to a gRPC server on startup and expects a predefined API there. For example, some service definitions of the API look like this:

// Runtime service defines the public APIs for remote container runtimes
service RuntimeService {
    rpc CreateContainer (...) returns (...) {}
    rpc ListContainers  (...) returns (...) {}
    rpc RemoveContainer (...) returns (...) {}
    rpc StartContainer  (...) returns (...) {}
    rpc StopContainer   (...) returns (...) {}

That seems to be pretty much what we already did with runc, managing the container life cycle. If we look further at the API, we see this:

    rpc ListPodSandbox  (...) returns (...) {}
    rpc RemovePodSandbox(...) returns (...) {}
    rpc RunPodSandbox   (...) returns (...) {}
    rpc StopPodSandbox  (...) returns (...) {}
}

What does “sandbox” mean? Containers should already be some kind of sandbox, right? Yes, but in the Kubernetes worldPods can consist of multiple containers, whereas this abstract hierarchy has to be mapped into a simple list of containers. Because of that, every creation of a Kubernetes Pod starts with the setup of a so called PodSandbox. Every container running inside the Pod is attached to this sandbox, so the containers inside can share common resources, like their network interfaces for example. runc alone does not provide such features out of the box, so we have to use a higher level runtime to achieve our goal.

CRI-O

CRI-O is a higher level container runtime which has been written on purpose to be used with the Kubernetes CRI. The name originates from the combination of the Container Runtime Interface and the Open Container Initiative. Isn’t that simple? CRI-O’s journey started as Kubernetes incubator project back in 2016 under the name Open Container Initiative Daemon (OCID). Version 1.0.0 has been released one year later in 2017 and follows the Kubernetes release cycles from that day on. This means for example, that the Kubernetes version 1.15 can be safely used together with CRI-O 1.15 and so on.

The implementation of CRI-O follows the main UNIX philosophy and tends to be a lightweight alternative to Docker or containerd when it comes to running production-ready workloads inside of Kubernetes. It is not meant to be a developers-facing tool which can be used from the command line. CRI-O has only one major task: Fulfilling the Kubernetes CRI. To achieve that, it utilizes runc for basic container management in the back, whereas the gRPC server provides the API in the front end. Everything in between is done either by CRI-O itself or by core libraries like containers/storage or containers/image. But in the end it doesn’t mean that we cannot play around with it, so let’s give it a try.

I prepared a container image called “crio-playground” to get started with CRI-O in an efficient manner. This image contains all necessary tools, example files and a working CRI-O instance running in the background. To start a privileged container running the crio-playground, simply execute:

> sudo podman run --privileged -h crio-playground -it saschagrunert/crio-playground
crio-playground:~ $

From now on we will use a tool called crictl to interface with CRI-O and its Container Runtime Interface implementation. crictl allows us to use YAML representations of the CRI API requests to send them to CRI-O. For example, we can create a new PodSandbox with the sandbox.yml lying around in the current working directory of the playground:

metadata:
  name: sandbox
  namespace: default
dns_config:
  servers:
    - 8.8.8.8

To create the sandbox in the running crio-playground container, we now execute:

crio-playground:~ $ crictl runp sandbox.yml
5f2b94f74b28c092021ad8eeae4903ada4b1ef306adf5eaa0e985672363d6336

Let’s store the identifier of the sandbox as $POD_ID environment variable for later usage as well:

crio-playground:~ $ export POD_ID=5f2b94f74b28c092021ad8eeae4903ada4b1ef306adf5eaa0e985672363d6336

If we now run crictl pods we can see that we finally have one PodSandbox up and running:

crio-playground:~ $ crictl pods
POD ID              CREATED             STATE               NAME                NAMESPACE           ATTEMPT
5f2b94f74b28c       43 seconds ago      Ready               sandbox             default             0

But what’s inside our sandbox? We surely can examine the sandbox further by using runc:

crio-playground:~ $ runc list
ID                                                                 PID         STATUS      BUNDLE                                                                                                             CREATED                          OWNER
5f2b94f74b28c092021ad8eeae4903ada4b1ef306adf5eaa0e985672363d6336   80          running     /run/containers/storage/vfs-containers/5f2b94f74b28c092021ad8eeae4903ada4b1ef306adf5eaa0e985672363d6336/userdata   2019-05-23T13:43:38.798531426Z   root

The sandbox seems to run in a dedicated bundle under /run/containers.

crio-playground:~ $ runc ps $POD_ID
UID        PID  PPID  C STIME TTY          TIME CMD
root        80    68  0 13:43 ?        00:00:00 /pause

Interestingly, there is only one process running inside the sandbox, called pause. As the source code of pause indicates, the main task of this process is to keep the environment running and react to incoming signals. Before we actually create our workload within that sandbox, we have to pre-pull the image we want to run. A trivial example would be to run a web server, so let’s retrieve a nginx image by calling:

crio-playground:~ $ crictl pull nginx:alpine
Image is up to date for docker.io/library/nginx@sha256:0fd68ec4b64b8dbb2bef1f1a5de9d47b658afd3635dc9c45bf0cbeac46e72101

Now let’s create a very simple container definition in YAML, like we did for the sandbox:

metadata:
  name: container
image:
  image: nginx:alpine

And now, let’s kick off the container. For that we have to provide the hash of the sandbox as well as the YAML definitions of the sandbox and container:

crio-playground:~ $ crictl create $POD_ID container.yml sandbox.yml
b205eb2c6abec3e7ade72e0cea09d827968a4c1089483cab06bdf0f4ee82ff0c

Seems to work! Let’s store the container identifier as $CONTAINER_ID for later reuse as well:

crio-playground:~ $ export CONTAINER_ID=b205eb2c6abec3e7ade72e0cea09d827968a4c1089483cab06bdf0f4ee82ff0c

What would you expect if we now check out the status of our two running containers while keeping the CRI API in mind? Correct, the container should be in the created state:

crio-playground:~ $ runc list
ID                                                                 PID         STATUS      BUNDLE                                                                                                             CREATED                          OWNER
5f2b94f74b28c092021ad8eeae4903ada4b1ef306adf5eaa0e985672363d6336   80          running     /run/containers/storage/vfs-containers/5f2b94f74b28c092021ad8eeae4903ada4b1ef306adf5eaa0e985672363d6336/userdata   2019-05-23T13:43:38.798531426Z   root
b205eb2c6abec3e7ade72e0cea09d827968a4c1089483cab06bdf0f4ee82ff0c   343         created     /run/containers/storage/vfs-containers/b205eb2c6abec3e7ade72e0cea09d827968a4c1089483cab06bdf0f4ee82ff0c/userdata   2019-05-23T14:08:53.701174406Z   root

And, like in our previous runc example, the container waits in runc init:

crio-playground:~ $ runc ps $CONTAINER_ID
UID        PID  PPID  C STIME TTY          TIME CMD
root       343   331  0 14:08 ?        00:00:00 /usr/sbin/runc init

crictl shows the container in created as well:

crio-playground:~ $ crictl ps -a
CONTAINER ID        IMAGE               CREATED             STATE               NAME                ATTEMPT             POD ID
b205eb2c6abec       nginx:alpine        13 minutes ago      Created             container           0                   5f2b94f74b28c

Now we have to start the workload to get it into the running state:

crio-playground:~ $ crictl start $CONTAINER_ID
b205eb2c6abec3e7ade72e0cea09d827968a4c1089483cab06bdf0f4ee82ff0c

This should be successful, too. Let’s verify if all processes are running correctly:

crio-playground:~ $ crictl ps
CONTAINER ID        IMAGE               CREATED             STATE               NAME                ATTEMPT             POD ID
b205eb2c6abec       nginx:alpine        15 minutes ago      Running             container           0                   5f2b94f74b28c

Inside the container should now run an nginx web server:

crio-playground:~ $ runc ps $CONTAINER_ID
UID        PID  PPID  C STIME TTY          TIME CMD
root       343   331  0 14:08 ?        00:00:00 nginx: master process nginx -g daemon off;
100        466   343  0 14:24 ?        00:00:00 nginx: worker process

But how to reach the web servers content now? We did not expose any ports or other advanced configuration for the container, so it should be fairly isolated from the host. The solution lies down in the container networking. Because we use a bridged network configuration in the crio-playground, we can simply access the containers network address. To get these we can exec into the container and list the network interfaces:

crio-playground:~ $ crictl exec $CONTAINER_ID ip addr
1: lo: <LOOPBACK,UP,LOWER_UP> mtu 65536 qdisc noqueue state UNKNOWN qlen 1000
    link/loopback 00:00:00:00:00:00 brd 00:00:00:00:00:00
    inet 127.0.0.1/8 scope host lo
       valid_lft forever preferred_lft forever
    inet6 ::1/128 scope host
       valid_lft forever preferred_lft forever
3: eth0: <BROADCAST,MULTICAST,UP,LOWER_UP> mtu 1500 qdisc noqueue state UP
    link/ether 16:04:8c:44:00:59 brd ff:ff:ff:ff:ff:ff
    inet 172.0.0.2/16 scope global eth0
       valid_lft forever preferred_lft forever
    inet6 fe80::1404:8cff:fe44:59/64 scope link
       valid_lft forever preferred_lft forever

And now just query the inet address for eth0:

crio-playground:~ $ curl 172.0.0.2
<!DOCTYPE html>
<html>
<head>
<title>Welcome to nginx!</title>
[output truncated]

Hooray, it works! We successfully run a Kubernetes workload without running Kubernetes!

The overall Kubernetes story about Network Plugins or the Container Network Interface (CNI) is worth another blog post, but that’s a different story and we stop right here with all the magic.

Conclusion

And that’s a wrap for this part of the blog series about the demystification of containers. We discovered the brief history of container runtimes and had the chance to run containers with the low level runtime runc as well as the higher level runtime CRI-O. I can really recommend to have a closer look at the OCI runtime specification and test different configurations within the crio-playground environment. For sure we will see CRI-O in the future again when we talk about container-related topics like security or networking. Besides that, we will have the chance to explore different tools like podmanbuildah or skopeo, which provide more advanced container management solutions. I really hope you enjoyed the read and will continue following my journey into future parts of this series. Feel free to drop me a line anywhere you can find me on the internet. Stay tuned!

You can find all necessary resources about this series on GitHub.

Demystifying Containers – Part I: Kernel Space

This series of blog posts and corresponding talks aims to provide you with a pragmatic view on containers from a historic perspective. Together we will discover modern cloud architectures layer by layer, which means we will start at the Linux Kernel level and end up at writing our own secure cloud native applications.

Simple examples paired with the historic background will guide you from the beginning with a minimal Linux environment up to crafting secure containers, which fit perfectly into todays’ and futures’ orchestration world. In the end it should be much easier to understand how features within the Linux kernel, container tools, runtimes, software defined networks and orchestration software like Kubernetes are designed and how they work under the hood.


Part I: Kernel Space

This first blog post (and talk) is scoped to Linux kernel related topics, which will provide you with the necessary foundation to build up a deep understanding about containers. We will gain an insight about the history of UNIX, Linux and talk about solutions like chroot, namespaces and cgroups combined with hacking our own examples. Besides this we will peel some containers to get a feeling about future topics we will talk about.

Introduction

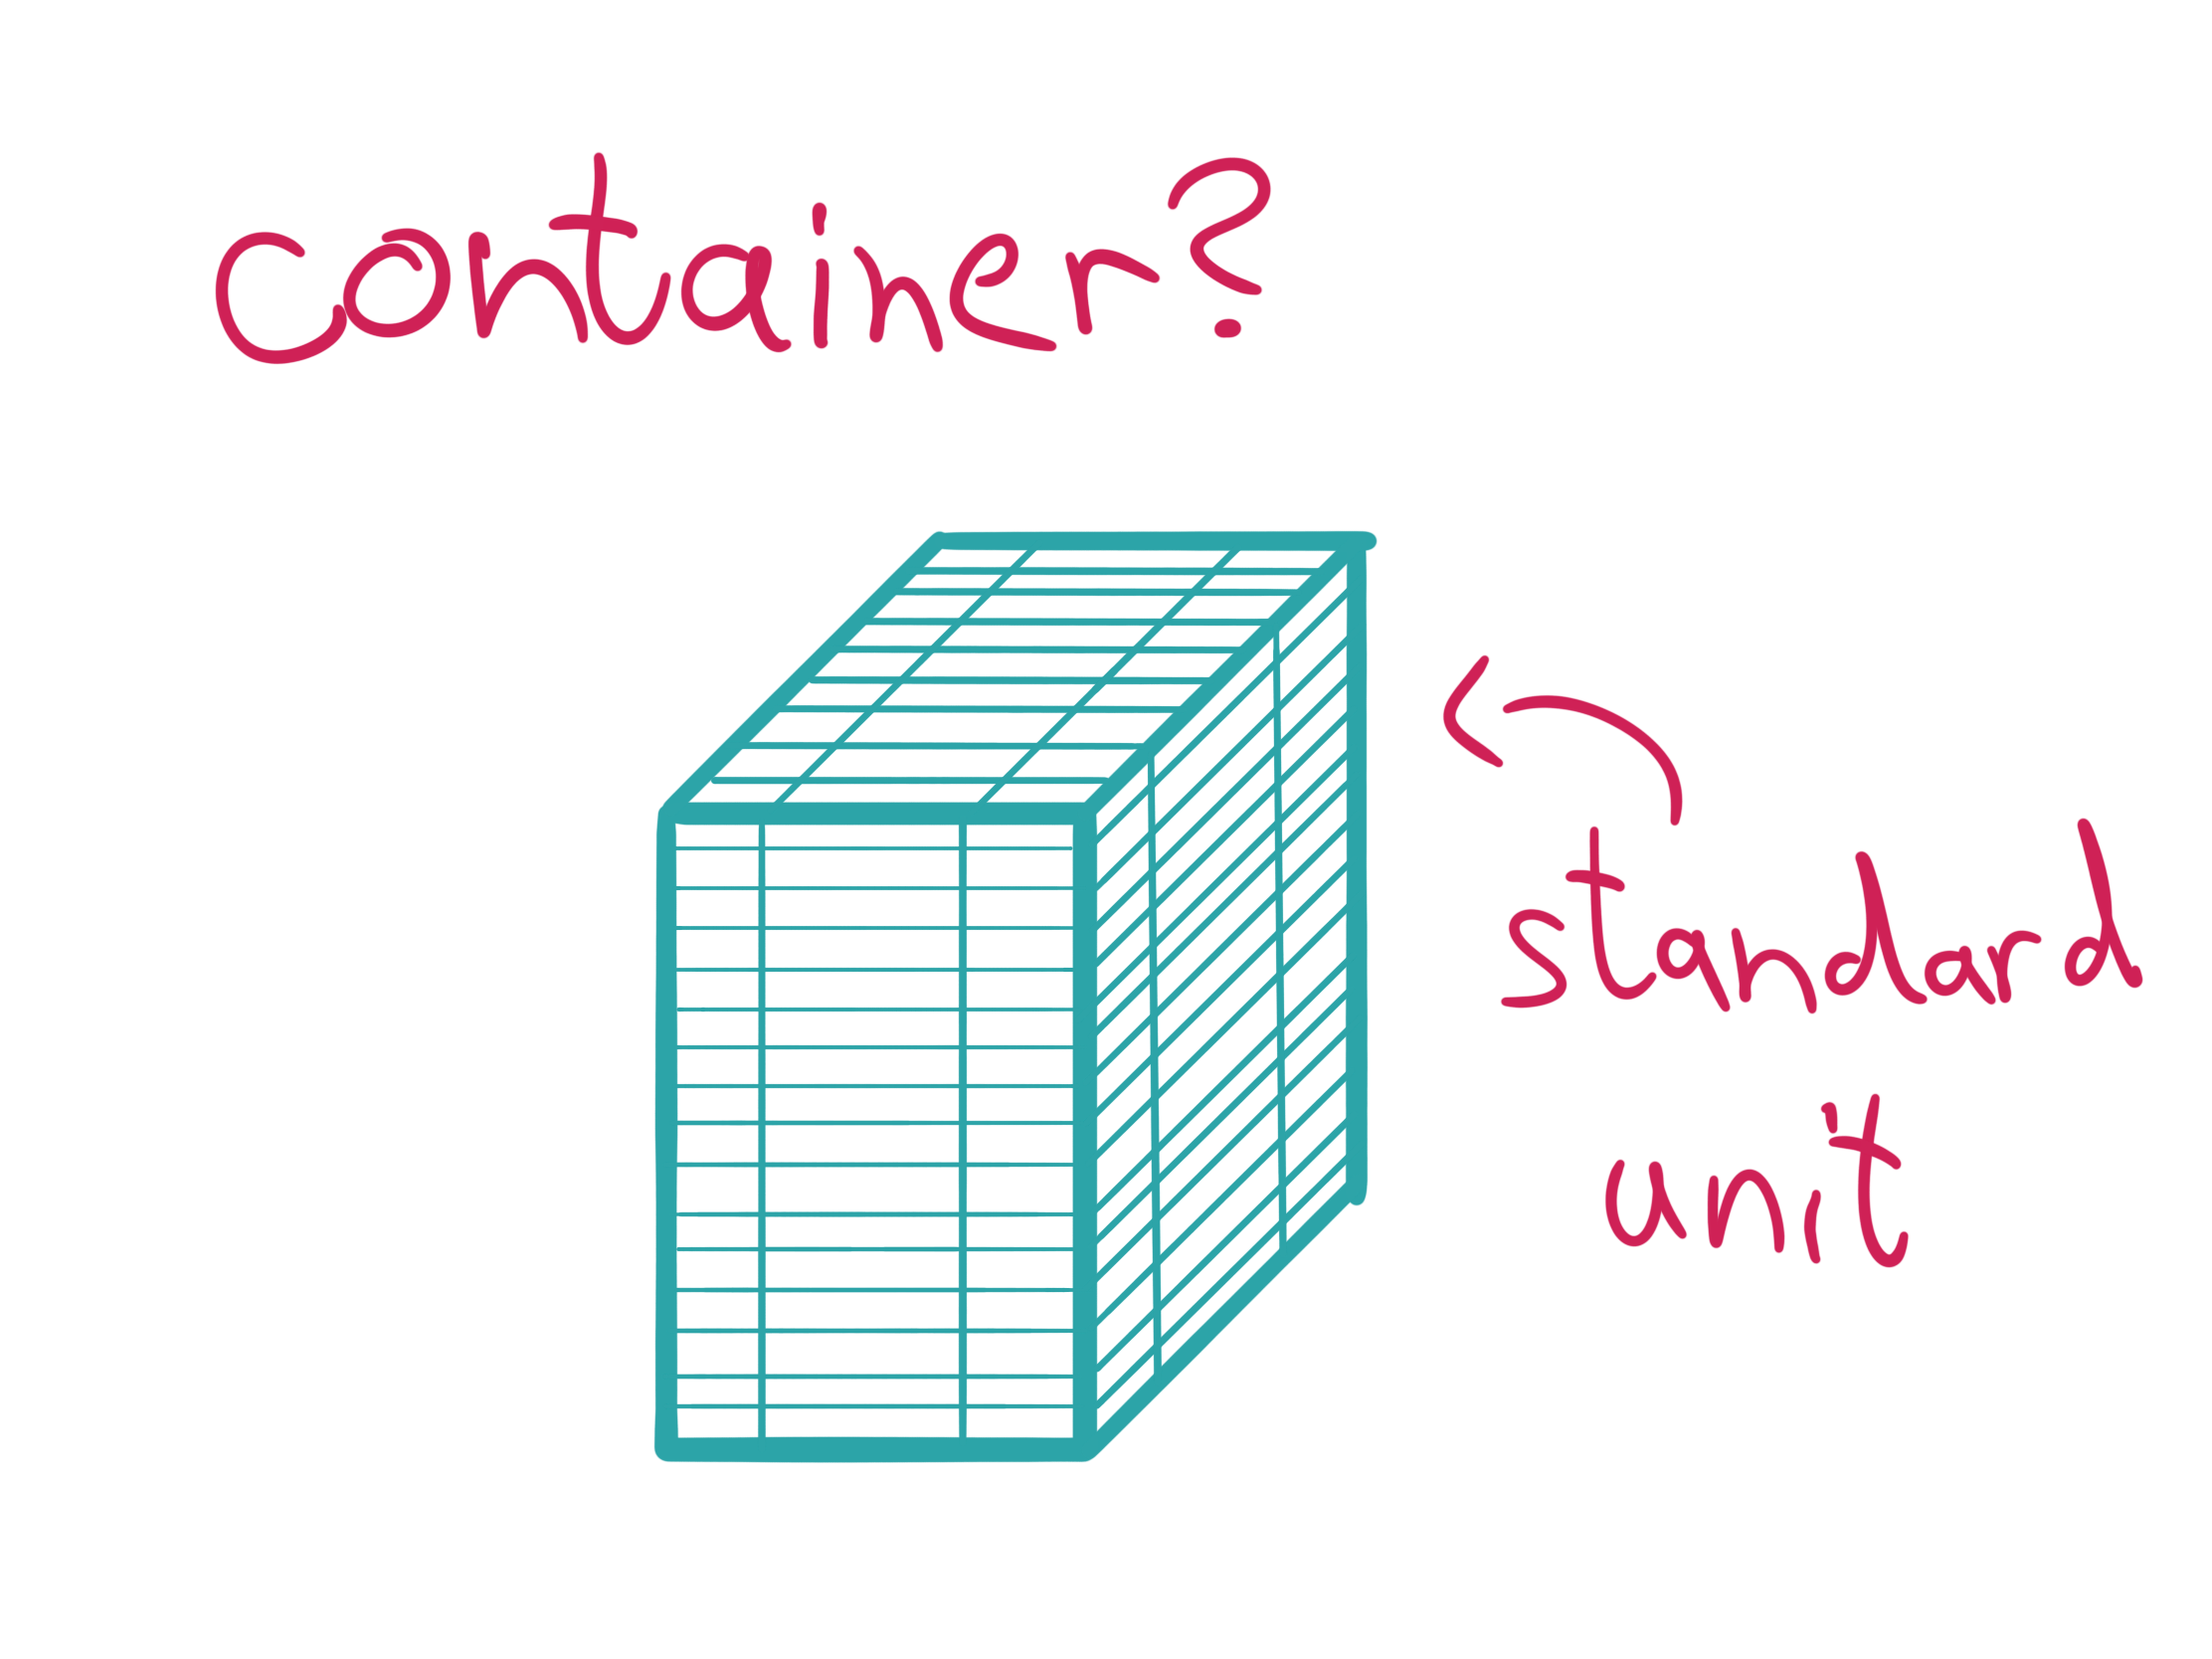
If we are talking about containers nowadays, most people tend to think of the big blue whale or the white steering wheel on the blue background.

Let’s put these thoughts aside and ask ourselves: What are containers in detail? If we look at the corresponding documentation of Kubernetes we only find explanations about “Why to use containers?“ and lots of references to Docker. Docker itself explains containers as “a standard unit of software“. Their explanations provide a general overview but do not reveal much of the underlying “magic“. Eventually, people tend to imagine containers as cheap virtual machines (VMs), which technically does not come close to the real world. This could be reasoned since the word “container” does not mean anything precisely at all. The same applies to the word “pod” in the container orchestration ecosystem.

If we strip it down then containers are only isolated groups of processes running on a single host, which fulfill a set of “common” features. Some of these fancy features are built directly into the Linux kernel and mostly all of them have different historical origins.

So containers have to fulfill four major requirements to be acceptable as such:

  1. Not negotiable: They have to run on a single host. Okay, so two computers cannot run a single container.
  2. Clearly: They are groups of processes. You might know that Linux processes live inside a tree structure, so we can say containers must have a root process.
  3. Okay: They need to be isolated, whatever this means in detail.
  4. Not so clear: They have to fulfill common features. Features in general seem to change over time, so we have to point out what the most common features are.

These requirements alone can lead into confusion and the picture is not clear yet. So let’s start from the historical beginning to keep things simple.

chroot

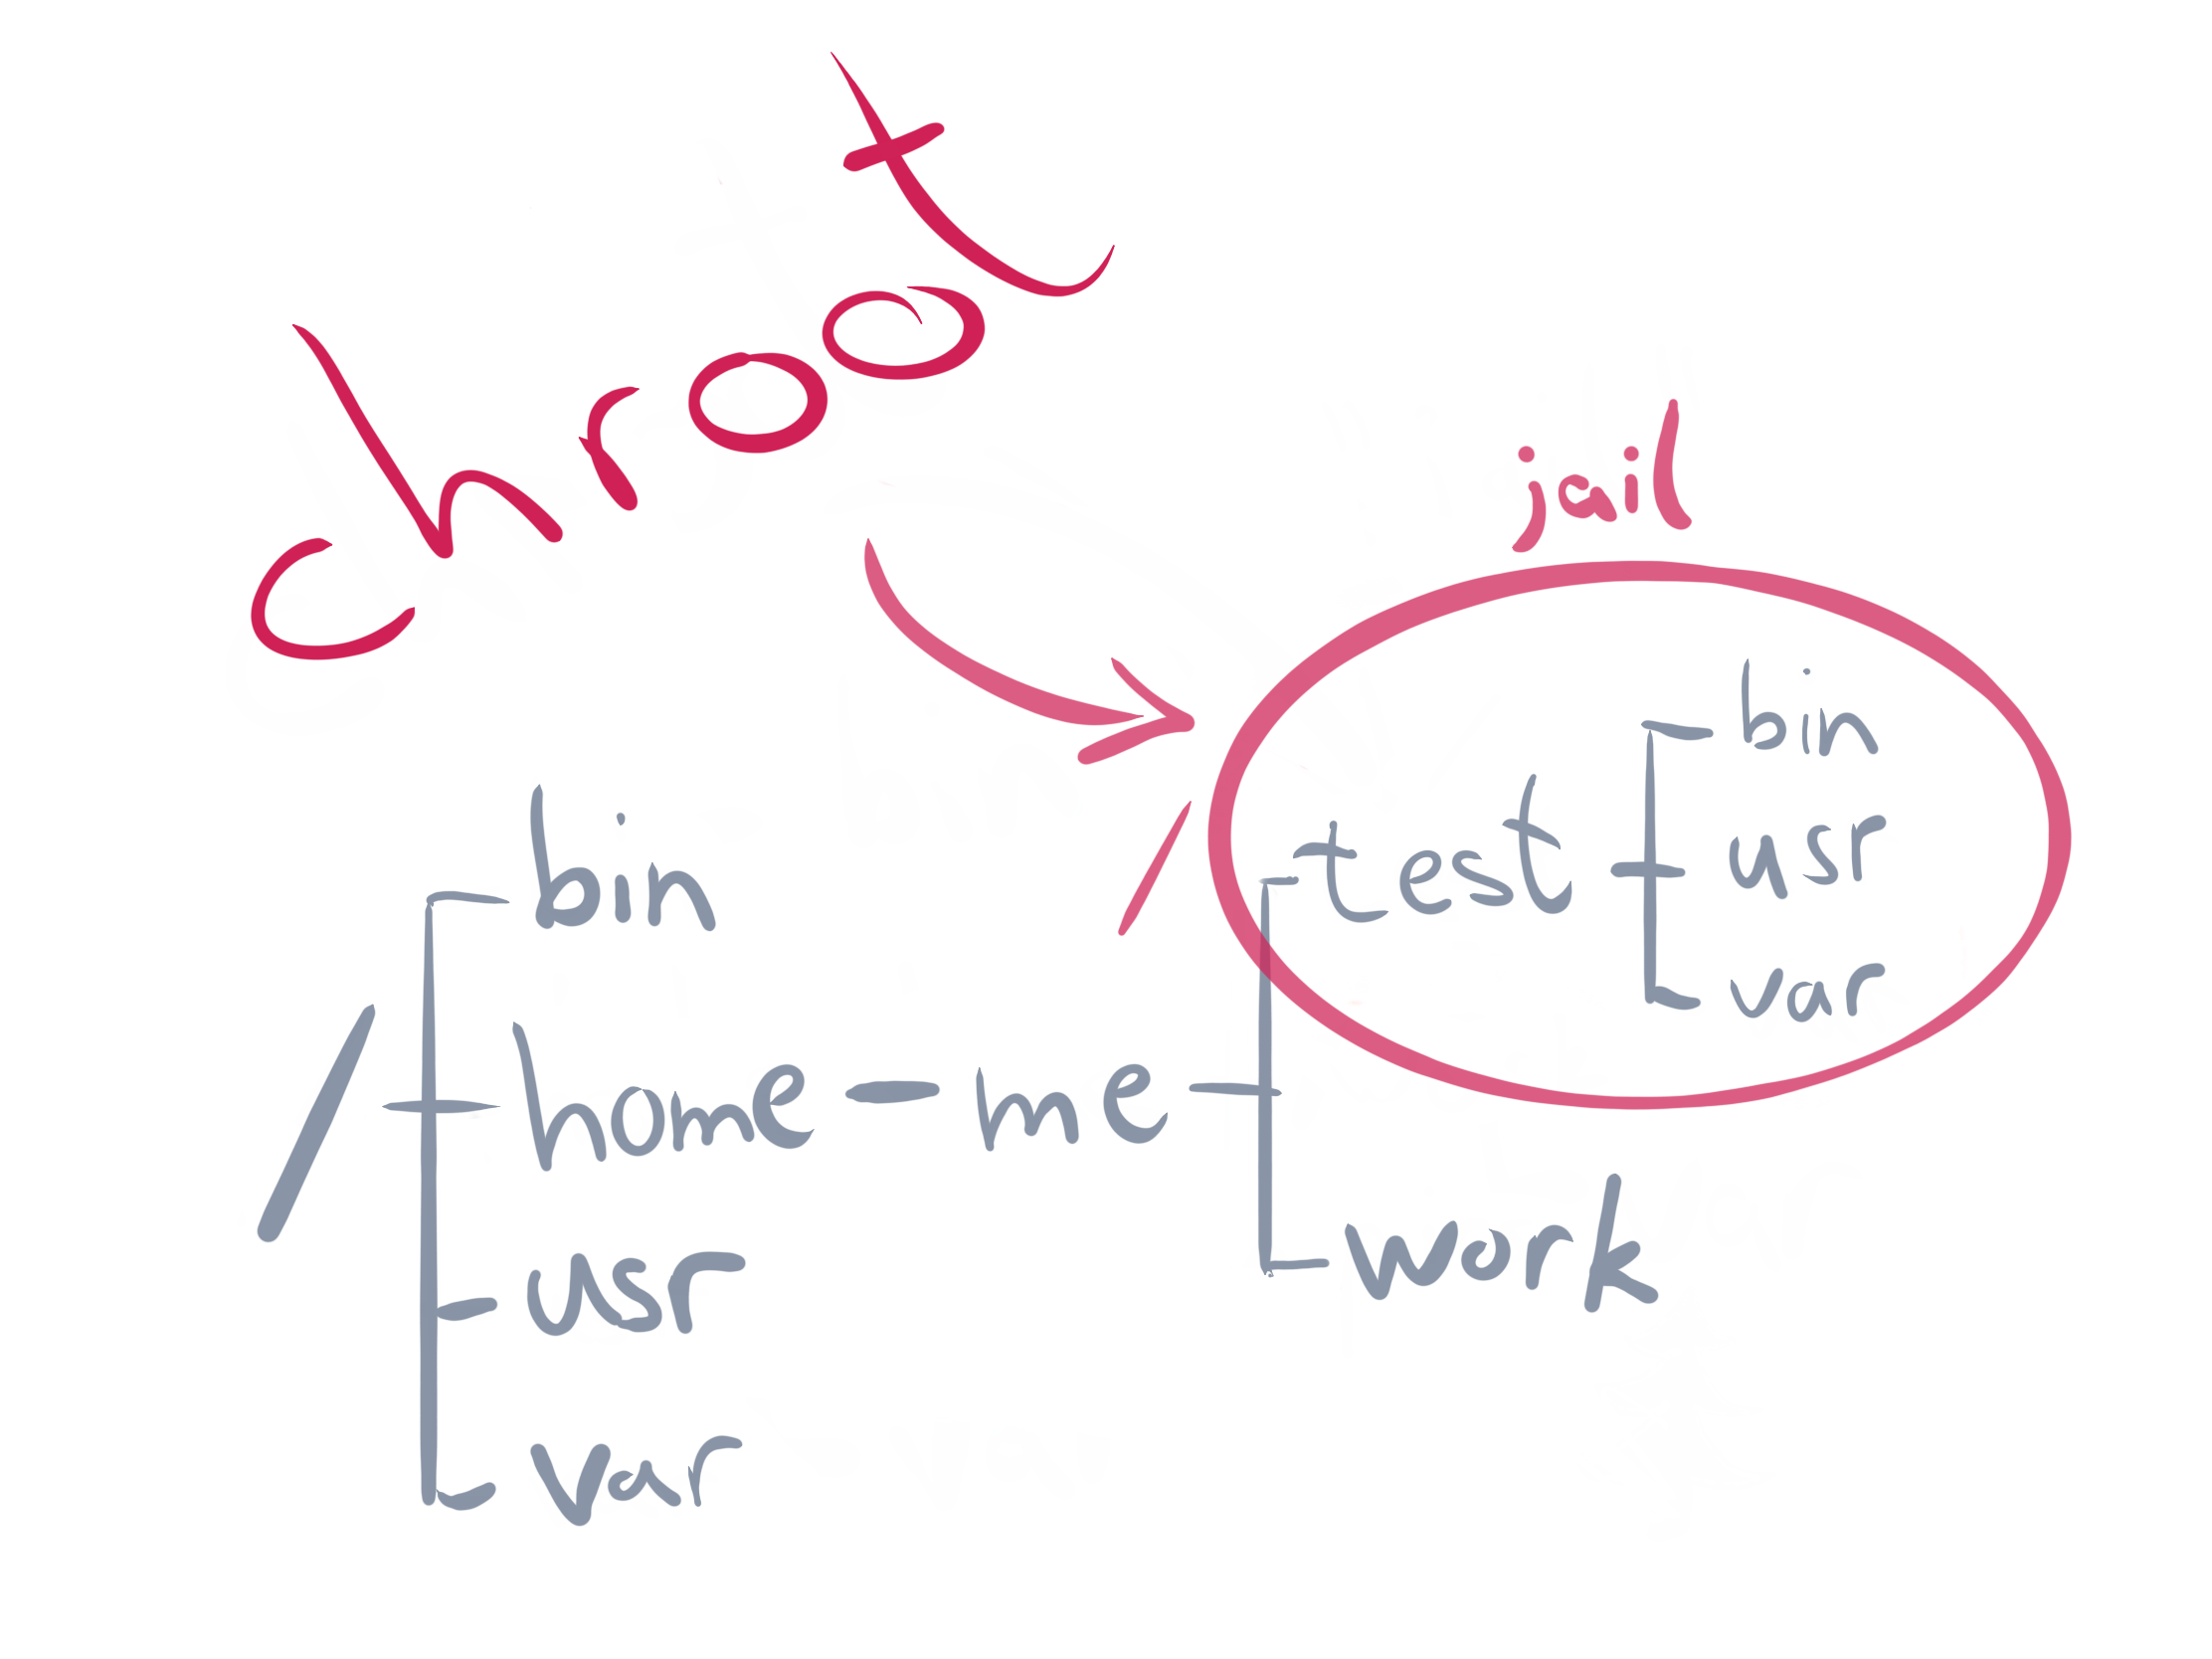
Mostly every UNIX operating system has the possibility to change the root directory of the current running process (and its children). This originates from the first occurrence of chroot in UNIX Version 7 (released 1979), from where it continued the journey into the awesome Berkeley Software Distribution (BSD). In Linux you can nowadays chroot(2) as system call (a kernel API function call) or the corresponding standalone wrapper program. Chroot is also referenced as “jail“, because some person used it as a honeypot to monitor a security hacker back in 1991. So chroot is much older than Linux and it has been (mis)used in the early 2000s for the first approaches in running applications as what we would call today “microservices”. Chroot is currently used by a wide range of applications, for example within build services for different distributions. Nowadays the BSD implementation differs a lots from the Linux one, where we will focus on the latter part for now.

What is needed to run an own chroot environment? Not that much, since something like this already works:

> mkdir -p new-root/{bin,lib64}
> cp /bin/bash new-root/bin
> cp /lib64/{ld-linux-x86-64.so*,libc.so*,libdl.so.2,libreadline.so*,libtinfo.so*} new-root/lib64
> sudo chroot new-root

We create a new root directory, copy a bash shell and its dependencies in and run chroot. This jail is pretty useless: All we have at hand is bash and its builtin functions like cd and pwd.

One might think it could be worth running a statically linked binary in a jail and that would be the same as running a container image. It’s absolutely not, and a jail is not really a standalone security feature but more a good addition to our container world.

The current working directory is left unchanged when calling chroot via a syscall, whereas relative paths can still refer to files outside of the new root. This call changes only the root path and nothing else. Beside this, further calls to chroot do not stack and they will override the current jail. Only privileged processes with the capability CAP_SYS_CHROOT are able to call chroot. At the end of the day the root user can easily escape from a jail by running a program like this:

#include <sys/stat.h>
#include <unistd.h>

int main(void)
{
    mkdir(".out", 0755);
    chroot(".out");
    chdir("../../../../../");
    chroot(".");
    return execl("/bin/bash", "-i", NULL);
}

We create a new jail by overwriting the current one and change the working directly to some relative path outside of the chroot environment. Another call to chroot might bring us outside of the jail which can be verified by spawning a new interactive bash shell.

Nowadays chroot is not used by container runtimes any more and was replaced by pivot_root(2), which has the benefit of putting the old mounts into a separate directory on calling. These old mounts could be unmounted afterwards to make the filesystem completely invisible to broken out processes.

To continue with a more useful jail we need an appropriate root filesystem (rootfs). This contains all binaries, libraries and the necessary file structure. But where to get one? What about peeling it from an already existing Open Container Initiative (OCI) container, which can be easily done with the two tools skopeo and umoci:

> skopeo copy docker://opensuse/tumbleweed:latest oci:tumbleweed:latest

[output removed]

> sudo umoci unpack –image tumbleweed:latest bundle

[output removed]

Now with our freshly downloaded and extracted rootfs we can chroot into the jail via:

> sudo chroot bundle/rootfs
#

It looks like we’re running inside a fully working environment, right? But what did we achieve? We can see that we may sneak-peak outside the jail from a process perspective:

> mkdir /proc
> mount -t proc proc /proc
> ps aux

[output removed]

There is no process isolation available at all. We can even kill programs running outside of the jail, what a metaphor! Let’s peek into the network devices:

> mkdir /sys
> mount -t sysfs sys /sys
> ls /sys/class/net
eth0 lo

There is no network isolation, too. This missing isolation paired with the ability to leave the jail leads into lots of security related concerns, because jails are sometimes used for wrong (security related) purposes. How to solve this? This is where the Linux namespaces join the party.

Linux Namespaces

Namespaces are a Linux kernel feature which were introduced back in 2002 with Linux 2.4.19. The idea behind a namespace is to wrap certain global system resources in an abstraction layer. This makes it appear like the processes within a namespace have their own isolated instance of the resource. The kernels namespace abstraction allows different groups of processes to have different views of the system.

Not all available namespaces were implemented from the beginning. A full support for what we now understand as “container ready” was finished in kernel version 3.8 back in 2013 with the introduction of the user namespace. We end up having currently seven distinct namespaces implemented: mnt, pid, net, ipc, uts, user and cgroup. No worries, we will discuss them in detail. In September 2016 two additional namespaces were proposed (time and syslog) which are not fully implemented yet. Let’s have a look into the namespace API before digging into certain namespaces.

API

The namespace API of the Linux kernel consists of three main system calls:
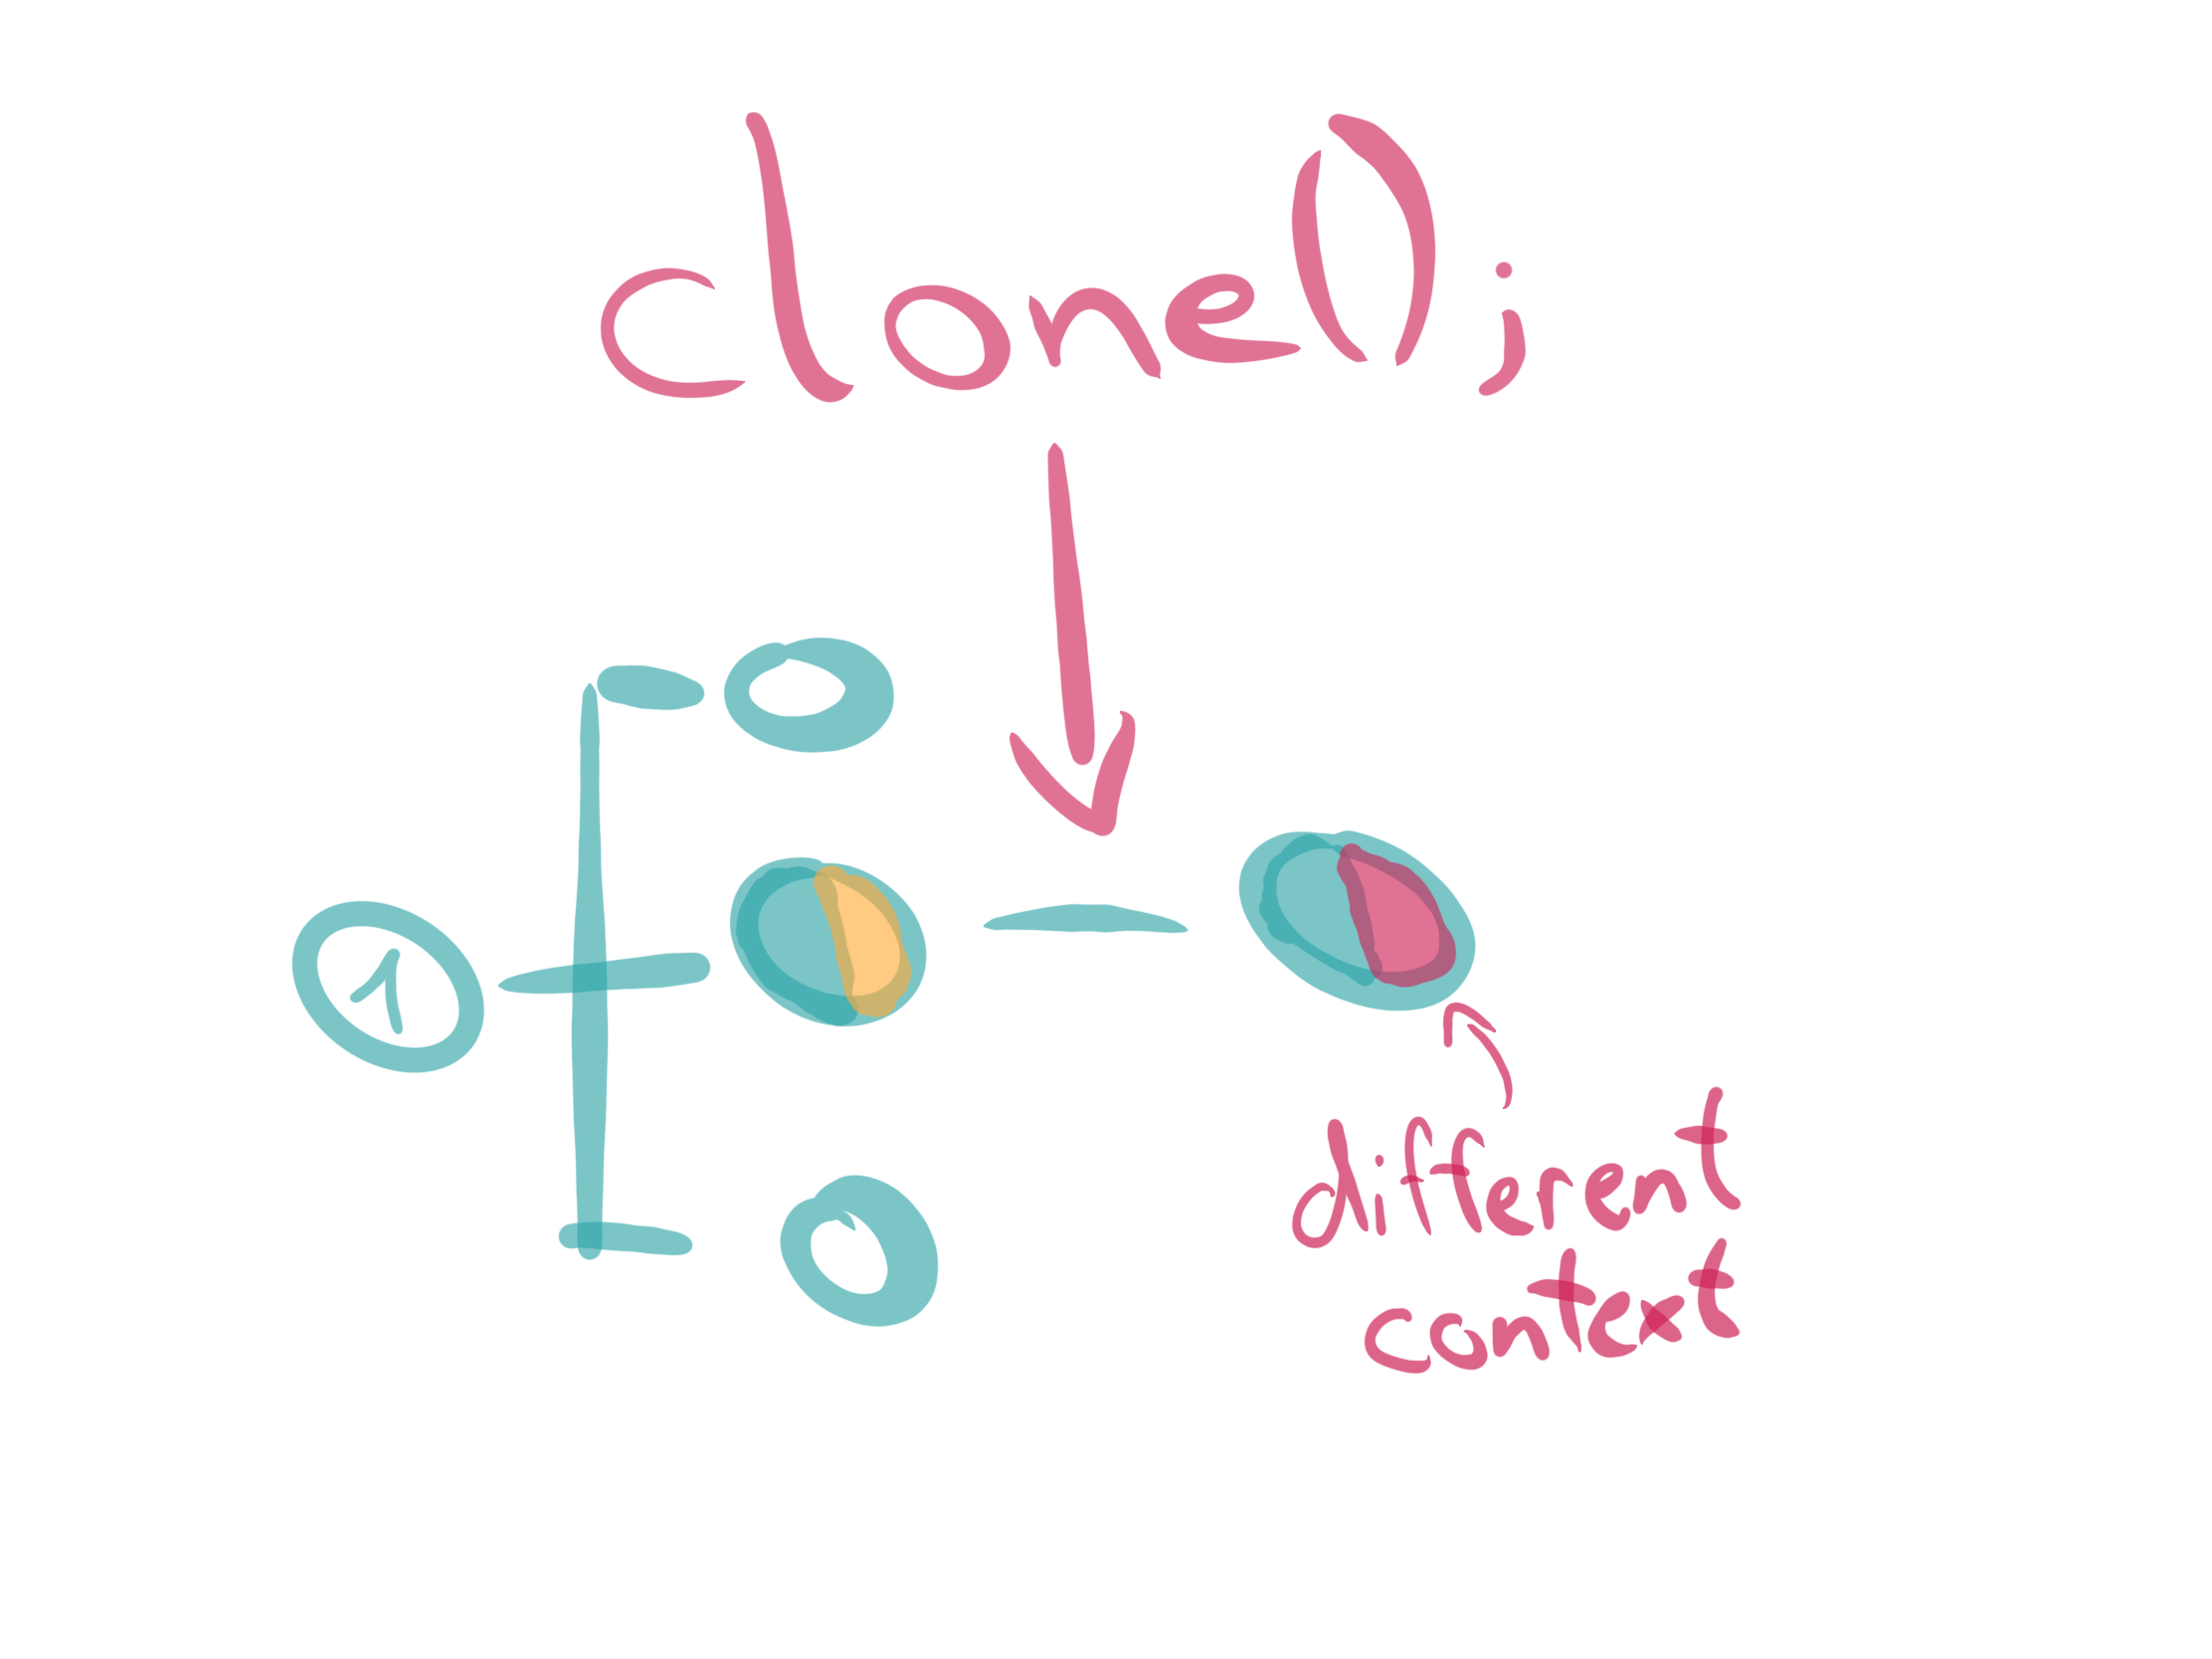
clone

The clone(2) API function creates a new child process, in a manner similar to fork(2). Unlike fork(2), the clone(2) API allows the child process to share parts of its execution context with the calling process, such as the memory space, the table of file descriptors, and the table of signal handlers. You can pass different namespace flags to clone(2)to create new namespaces for the child process.
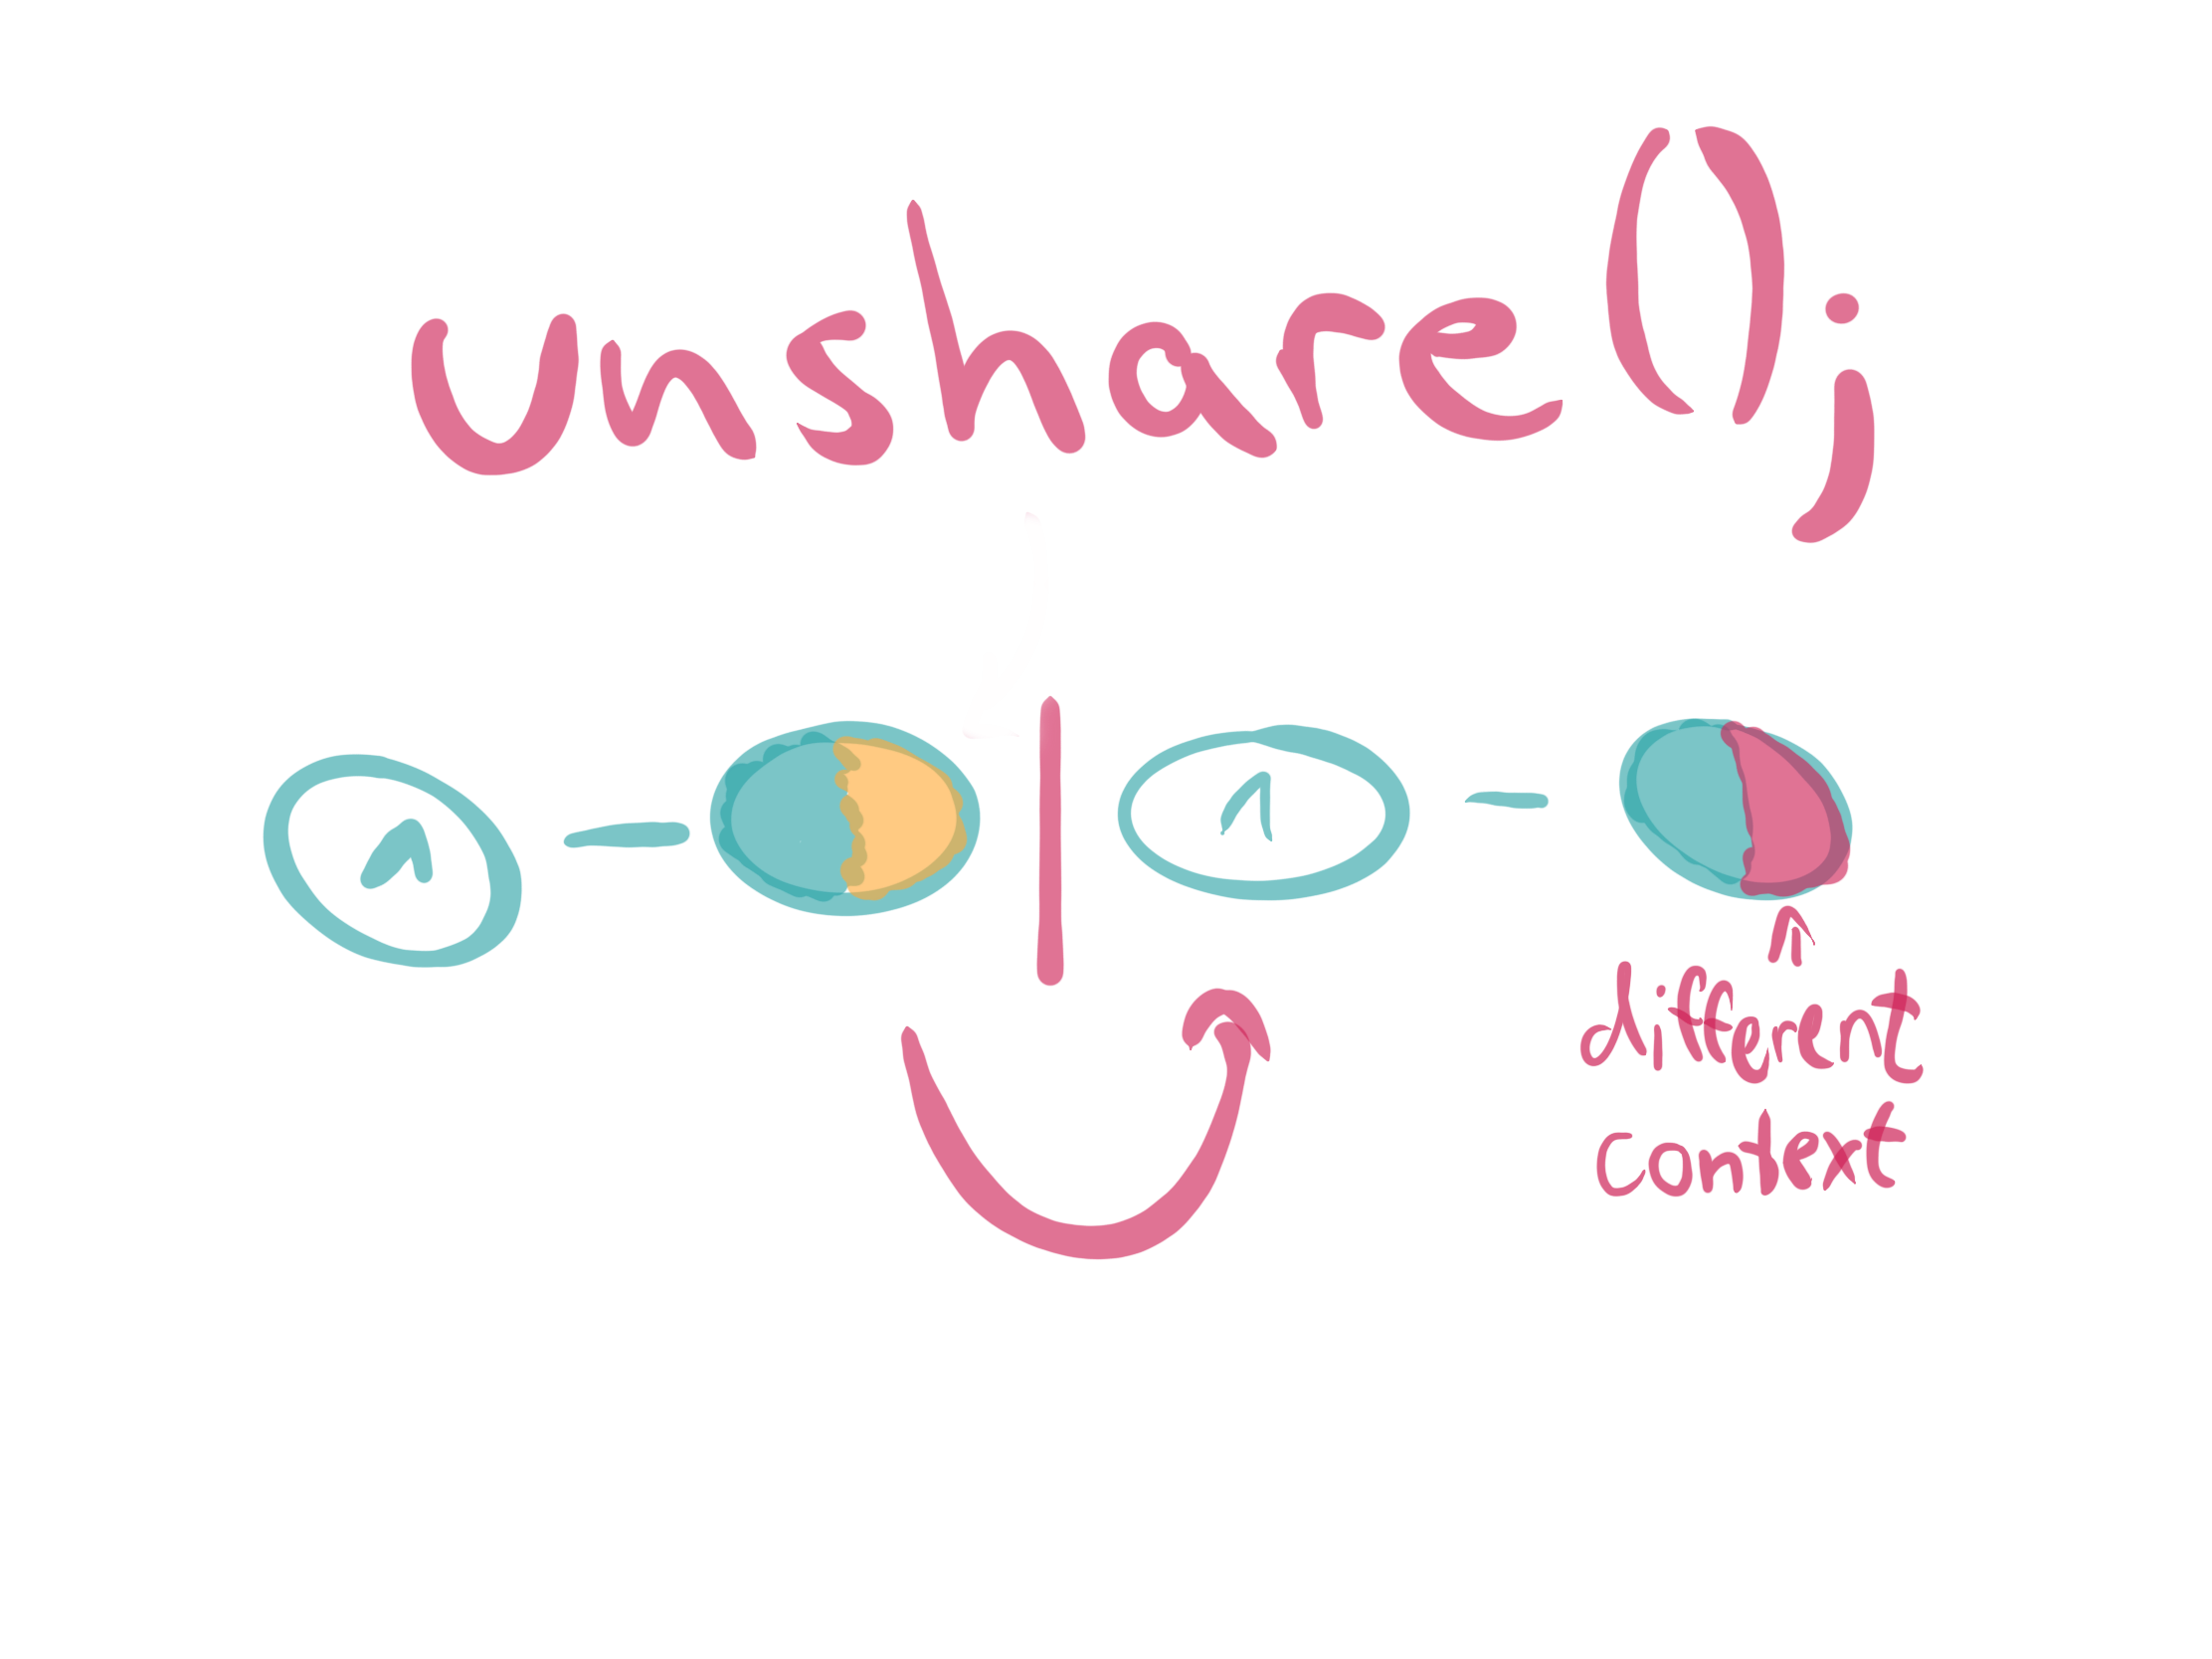
unshare

The function unshare(2) allows a process to disassociate parts of the execution context which are currently being shared with others.
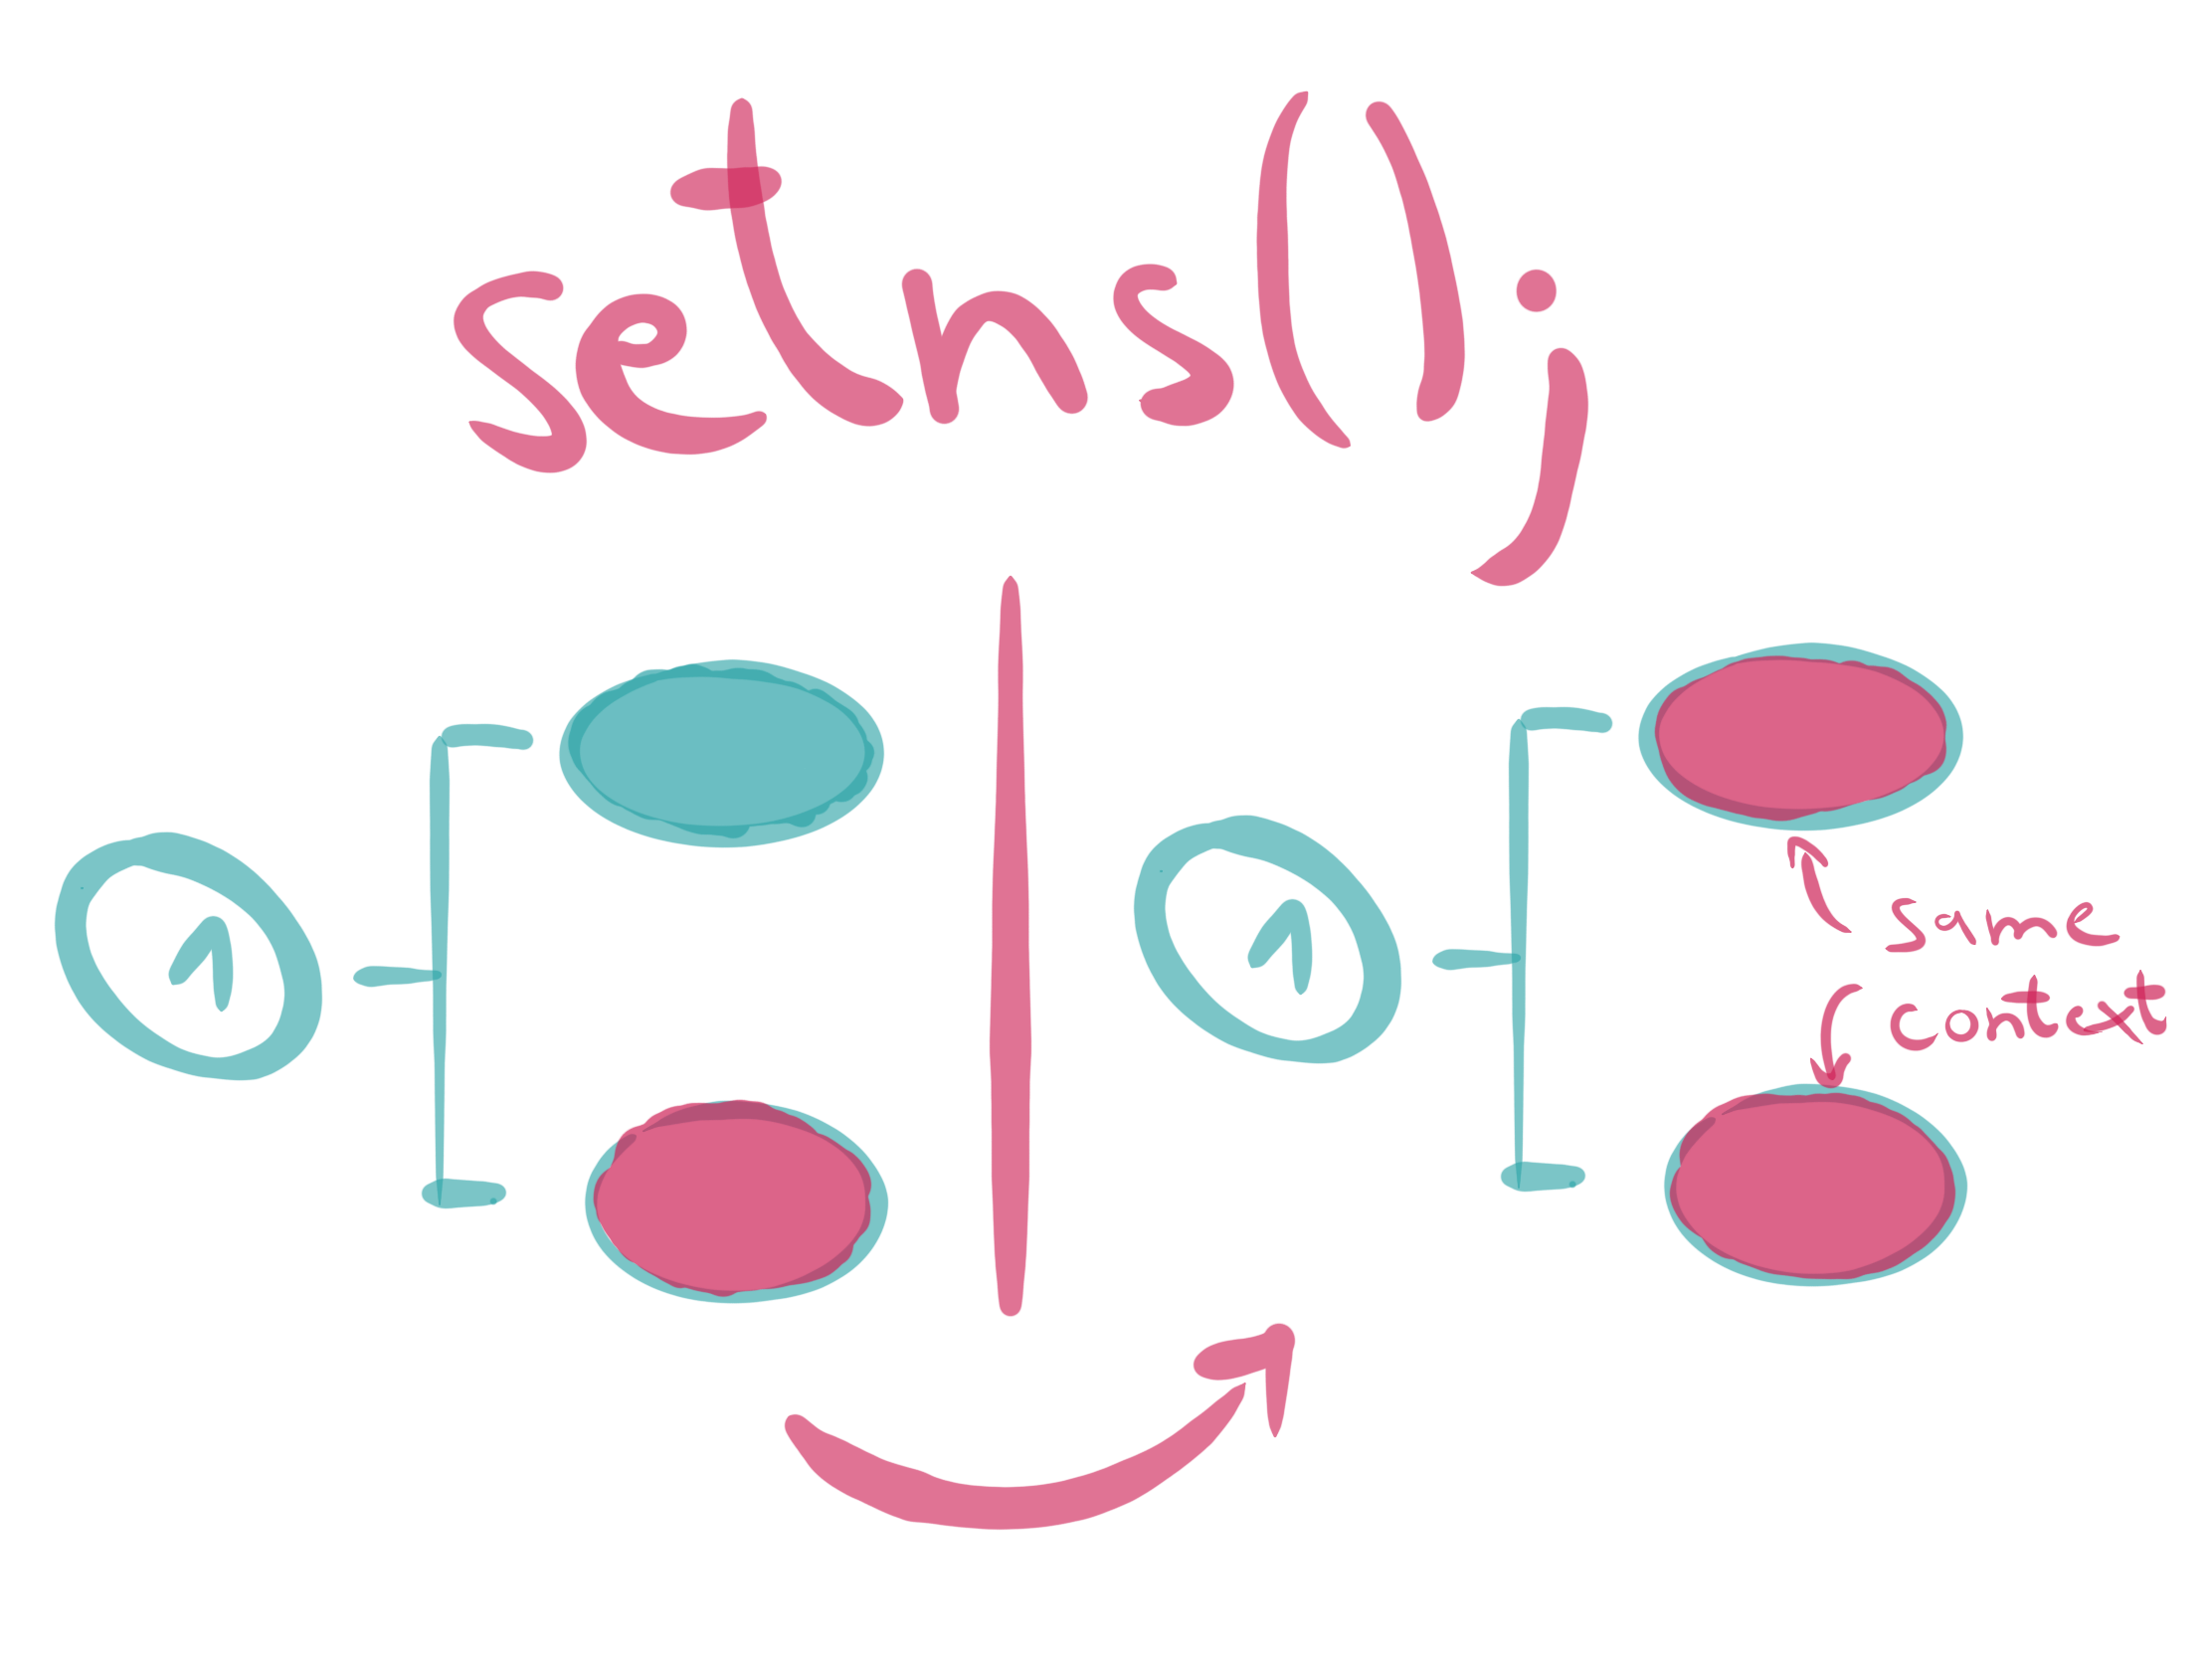
setns

The function setns(2) reassociates the calling thread with the provided namespace file descriptor. This function can be used to join an existing namespace.

proc

Besides the available syscalls, the proc filesystem populates additional namespace related files. Since Linux 3.8, each file in /proc/$PID/ns is a “magic“ link which can be used as a handle for performing operations (like setns(2)) to the referenced namespace.

> ls -Gg /proc/self/ns/
total 0
lrwxrwxrwx 1 0 Feb  6 18:32 cgroup -> 'cgroup:[4026531835]'
lrwxrwxrwx 1 0 Feb  6 18:32 ipc -> 'ipc:[4026531839]'
lrwxrwxrwx 1 0 Feb  6 18:32 mnt -> 'mnt:[4026531840]'
lrwxrwxrwx 1 0 Feb  6 18:32 net -> 'net:[4026532008]'
lrwxrwxrwx 1 0 Feb  6 18:32 pid -> 'pid:[4026531836]'
lrwxrwxrwx 1 0 Feb  6 18:32 pid_for_children -> 'pid:[4026531836]'
lrwxrwxrwx 1 0 Feb  6 18:32 user -> 'user:[4026531837]'
lrwxrwxrwx 1 0 Feb  6 18:32 uts -> 'uts:[4026531838]'

This allows us for example to track in which namespaces certain processes reside. Another way to play around with namespaces apart from the programmatic approach is using tools from the util-linux package. This contains dedicated wrapper programs for the mentioned syscalls. One handy tool related to namespaces within this package is lsns. It lists useful information about all currently accessible namespaces or about a single given one. But now let’s finally get our hands dirty.

Available Namespaces

Mount (mnt)

The first namespace we want to try out is the mnt namespace, which was the first implemented one back in 2002. During that time (mostly) no one thought that multiple namespaces would ever be needed, so they decided to call the namespace clone flag CLONE_NEWNS. This leads into a small inconsistency with other namespace clone flags (I see you suffering!). With the mnt namespace Linux is able to isolate a set of mount points by a group of processes.

A great use case of the mnt namespace is to create environments similar to jails, but in a more secure fashion. How to create such a namespace? This can be easily done via an API function call or the unshare command line tool. So we can do this:

> sudo unshare -m
# mkdir mount-dir
# mount -n -o size=10m -t tmpfs tmpfs mount-dir
# df mount-dir
Filesystem     1K-blocks  Used Available Use% Mounted on
tmpfs              10240     0     10240   0% <PATH>/mount-dir
# touch mount-dir/{0,1,2}

Looks like we have a successfully mounted tmpfs, which is not available on the host system level:

> ls mount-dir
> grep mount-dir /proc/mounts
>

The actual memory being used for the mount point is laying in an abstraction layer called Virtual File System (VFS), which is part of the kernel and where every other filesystem is based on. If the namespace gets destroyed, the mount memory is unrecoverably lost. The mount namespace abstraction gives us the possibility to create entire virtual environments in which we are the root user even without root permissions.

On the host system we are able to see the mount point via the mountinfo file inside of the proc filesystem:

> grep mount-dir /proc/$(pgrep -u root bash)/mountinfo
349 399 0:84 / /mount-dir rw,relatime - tmpfs tmpfs rw,size=1024k

How to work with these mount points on a source code level? Well, programs tend to keep a file handle on the corresponding /proc/$PID/ns/mnt file, which refers to the used namespace. In the end mount namespace related implementation scenarios can be really complex, but they give us the power to create flexible container filesystem trees. The last thing I want to mention is that mounts can have different flavors (shared, slave, private, unbindable), which is best explained within the shared subtree documentation of the Linux kernel.

UNIX Time-sharing System (uts)

The UTS namespace was introduced in Linux 2.6.19 (2006) and allows us to unshare the domain- and hostname from the current host system. Let’s give it a try:

> sudo unshare -u
# hostname
nb
# hostname new-hostname
# hostname
new-hostname

And if we look at the system level nothing has changed, hooray:

> hostname
nb

The UTS namespace is yet another nice addition in containerization, especially when it comes to container networking related topics.

Interprocess Communication (ipc)

IPC namespaces came with Linux 2.6.19 (2006) too and isolate interprocess communication (IPC) resources. In special these are System V IPC objects and POSIX message queues. One use case of this namespace would be to separate the shared memory (SHM) between two processes to avoid misusage. Instead, each process will be able to use the same identifiers for a shared memory segment and produce two distinct regions. When an IPC namespace is destroyed, then all IPC objects in the namespace are automatically destroyed, too.

Process ID (pid)

The PID namespace was introduced in Linux 2.6.24 (2008) and gives processes an independent set of process identifiers (PIDs). This means that processes which reside in different namespaces can own the same PID. In the end a process has two PIDs: the PID inside the namespace, and the PID outside the namespace on the host system. The PID namespaces can be nested, so if a new process is created it will have a PID for each namespace from its current namespace up to the initial PID namespace.

The first process created in a PID namespace gets the number 1 and gains all the same special treatment as the usual init process. For example, all processes within the namespace will be re-parented to the namespace’s PID 1 rather than the host PID 1. In addition the termination of this process will immediately terminate all processes in its PID namespace and any descendants. Let’s create a new PID namespace:

> sudo unshare -fp --mount-proc
# ps aux
USER       PID %CPU %MEM    VSZ   RSS TTY      STAT START   TIME COMMAND
root         1  0.4  0.6  18688  6608 pts/0    S    23:15   0:00 -bash
root        39  0.0  0.1  35480  1768 pts/0    R+   23:15   0:00 ps aux

Looks isolated, doesn’t it? The --mount-proc flag is needed to re-mount the proc filesystem from the new namespace. Otherwise we would not see the PID subtree corresponding with the namespace. Another option would be to manually mount the proc filesystem via mount -t proc proc /proc, but this also overrides the mount from the host where it has to be remounted afterwards.

Network (net)

Network namespaces were completed in Linux 2.6.29 (2009) and can be used to virtualize the network stack. Each network namespace contains its own resource properties within /proc/net. Furthermore, a network namespace contains only a loopback interface on initial creation. Let’s create one:

> sudo unshare -n
# ip l
1: lo: <LOOPBACK> mtu 65536 qdisc noop state DOWN mode DEFAULT group default qlen 1000
    link/loopback 00:00:00:00:00:00 brd 00:00:00:00:00:00

Every network interface (physical or virtual) is present exactly once per namespace. It is possible that an interface will be moved between namespaces. Each namespace contains a private set of IP addresses, its own routing table, socket listing, connection tracking table, firewall, and other network-related resources.

Destroying a network namespace destroys any virtual and moves any physical interfaces within it back to the initial network namespace.

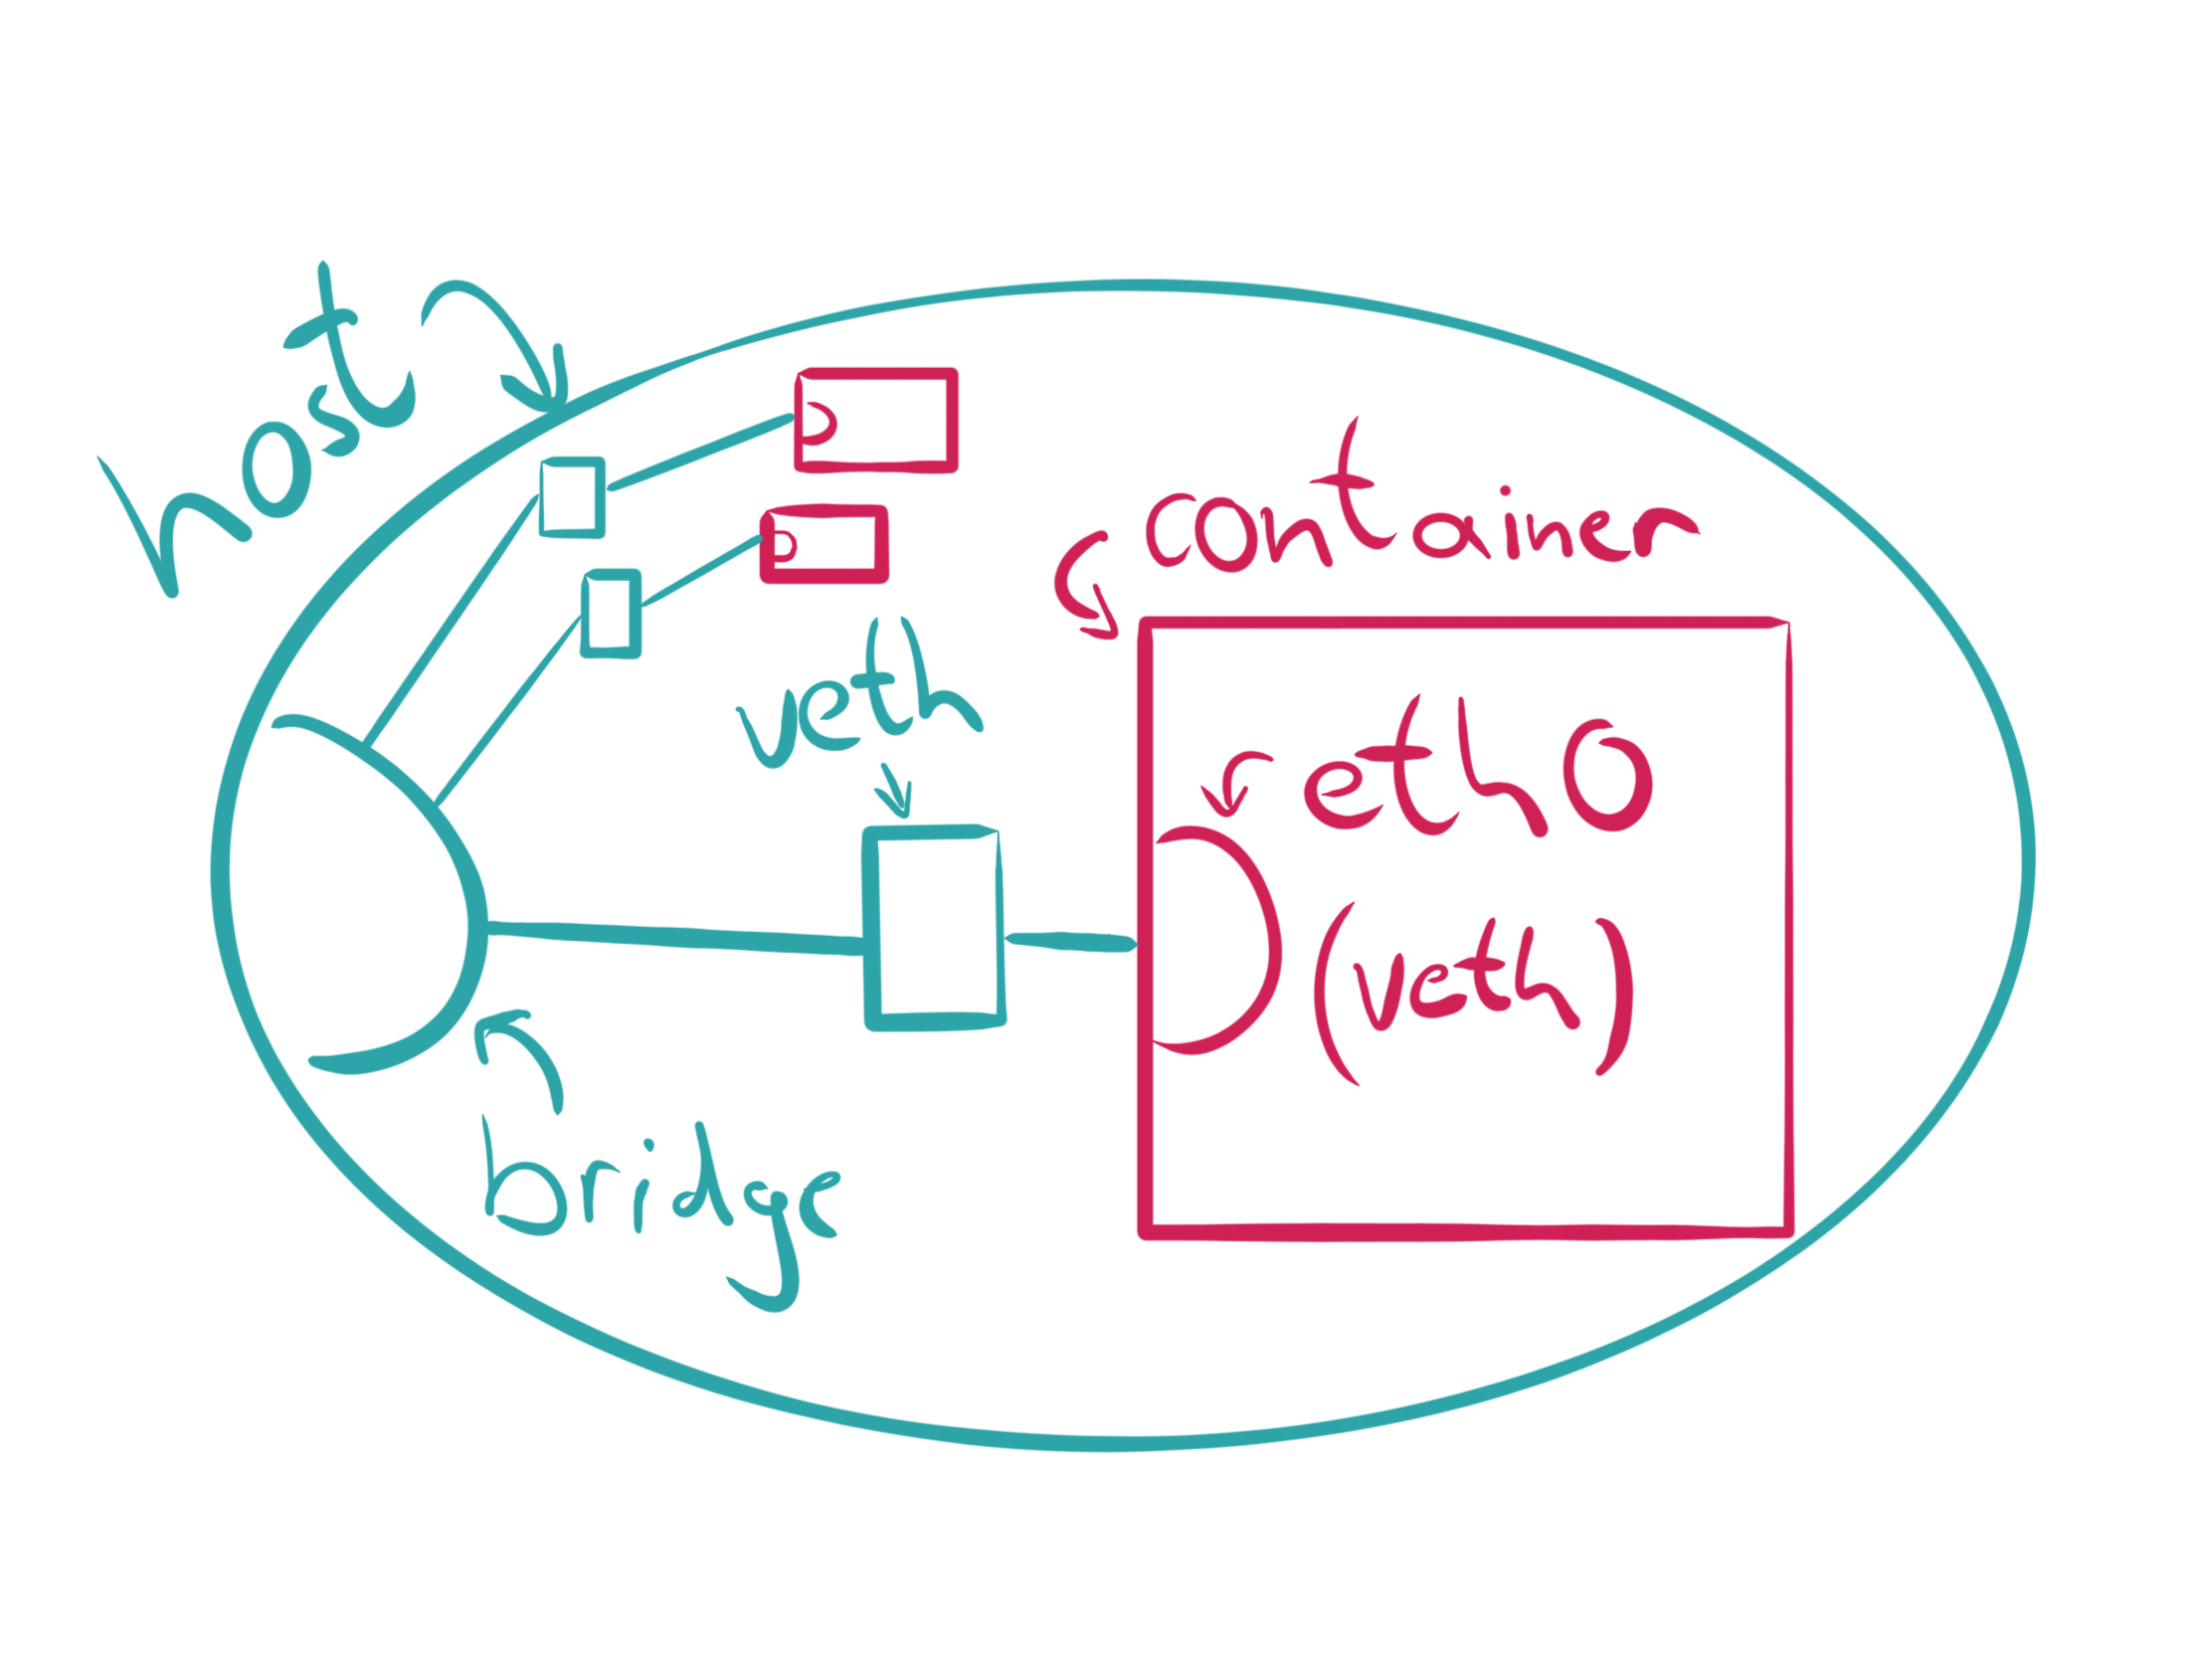
A possible use case for the network namespace is creating Software Defined Networks (SDN) via virtual Ethernet (veth) interface pairs. One end of the network pair will be plugged into a bridged interface whereas the other end will be assigned to the target container. This is how pod networks like flannel work in general.

Let’s see how it works. First, we need to create a new network namespace, which can be done via ip, too:

> sudo ip netns add mynet
> sudo ip netns list
mynet

So we created a new network namespace called mynet. When ip creates a network namespace, it will create a bind mount for it under /var/run/netns too. This allows the namespace to persist even when no processes are running within it.

With ip netns exec we can inspect and manipulate our network namespace even further:

> sudo ip netns exec mynet ip l
1: lo: <LOOPBACK> mtu 65536 qdisc noop state DOWN mode DEFAULT group default qlen 1000
    link/loopback 00:00:00:00:00:00 brd 00:00:00:00:00:00
> sudo ip netns exec mynet ping 127.0.0.1
connect: Network is unreachable

The network seems down, let’s bring it up:

> sudo ip netns exec mynet ip link set dev lo up
> sudo ip netns exec mynet ping 127.0.0.1
PING 127.0.0.1 (127.0.0.1) 56(84) bytes of data.
64 bytes from 127.0.0.1: icmp_seq=1 ttl=64 time=0.016 ms

Hooray! Now let’s create a veth pair which should allow communication later on:

> sudo ip link add veth0 type veth peer name veth1
> sudo ip link show type veth
11: veth1@veth0: <BROADCAST,MULTICAST,M-DOWN> mtu 1500 qdisc noop state DOWN mode DEFAULT group default qlen 1000
    link/ether b2:d1:fc:31:9c:d3 brd ff:ff:ff:ff:ff:ff
12: veth0@veth1: <BROADCAST,MULTICAST,M-DOWN> mtu 1500 qdisc noop state DOWN mode DEFAULT group default qlen 1000
    link/ether ca:0f:37:18:76:52 brd ff:ff:ff:ff:ff:ff

Both interfaces are automatically connected, which means that packets sent to veth0 will be received by veth1 and vice versa. Now we associate one end of the veth pair to our network namespace:

> sudo ip link set veth1 netns mynet
> ip link show type veth
12: veth0@if11: <BROADCAST,MULTICAST> mtu 1500 qdisc noop state DOWN mode DEFAULT group default qlen 1000
    link/ether ca:0f:37:18:76:52 brd ff:ff:ff:ff:ff:ff link-netns mynet

Our network interfaces need some addresses for sure:

> sudo ip netns exec mynet ip addr add 172.2.0.1/24 dev veth1
> sudo ip netns exec mynet ip link set dev veth1 up
> sudo ip addr add 172.2.0.2/24 dev veth0
> sudo ip link set dev veth0 up

Communicating in both directions should now be possible:

> ping -c1 172.2.0.1
PING 172.2.0.1 (172.2.0.1) 56(84) bytes of data.
64 bytes from 172.2.0.1: icmp_seq=1 ttl=64 time=0.036 ms

--- 172.2.0.1 ping statistics ---
1 packets transmitted, 1 received, 0% packet loss, time 0ms
rtt min/avg/max/mdev = 0.036/0.036/0.036/0.000 ms
> sudo ip netns exec mynet ping -c1 172.2.0.2
PING 172.2.0.2 (172.2.0.2) 56(84) bytes of data.
64 bytes from 172.2.0.2: icmp_seq=1 ttl=64 time=0.020 ms

--- 172.2.0.2 ping statistics ---
1 packets transmitted, 1 received, 0% packet loss, time 0ms
rtt min/avg/max/mdev = 0.020/0.020/0.020/0.000 ms

It works, but we wouldn’t have any internet access from the network namespace. We would need a network bridge or something similar for that and a default route from the namespace. I leave this task up to you, for now let’s go on to the next namespace.

User ID (user)

With Linux 3.5 (2012) the isolation of user and group IDs was finally possible via namespaces. Linux 3.8 (2013) made it possible to create user namespaces even without being actually privileged. The user namespace enables that a user and group IDs of a process can be different inside and outside of the namespace. An interesting use-case is that a process can have a normal unprivileged user ID outside a user namespace while being fully privileged inside.

Let’s give it a try:

> id -u
1000
> unshare -U
> whoami
nobody

After the namespace creation, the files /proc/$PID/{u,g}id_map expose the mappings for user and group IDs for the PID. These files can be written only once to define the mappings.

In general each line within these files contain a one to one mapping of a range of contiguous user IDs between two user namespaces and could look like this:

> cat /proc/$PID/uid_map
0 1000 1

The example above translates to: With the starting user ID 0 the namespace maps to a range starting at ID 1000. This applies only to the user with the ID 1000, since the defined length is 1.

If now a process tries to access a file, its user and group IDs are mapped into the initial user namespace for the purpose of permission checking. When a process retrieves file user and group IDs (via stat(2)), the IDs are mapped in the opposite direction.

In the unshare example (we did above) we implicitly call getuid(2) before writing an appropriate user mapping, which will result in an unmapped ID. This unmapped ID is automatically converted to the overflow user ID (65534 or the value in /proc/sys/kernel/overflow{g,u}id).

The file /proc/$PID/setgroups contains either allow or deny to enable or disable the permission to call thesetgroups(2) syscall within the user namespace. The file was added to address an added security issue introduced with the user namespace: It would be possible to an unprivileged process to create a new namespace in which the user had all privileges. This formerly unprivileged user would be able to drop groups via setgroups(2) to gain access to files he previously not had.

In the end the user namespace enables great security additions to the container world, which are essential for running rootless containers.

Control Group (cgroup)

Cgroups started their journey 2008 with Linux 2.6.24 as dedicated Linux kernel feature. The main goal of cgroups is to support resource limiting, prioritization, accounting and controlling. A major redesign started with version 2 in 2013, whereas the cgroup namespace was added with Linux 4.6 (2016) to prevent leaking host information into a namespace. The second version of cgroups were released there too and major features were added since then. One latest example is an Out-of-Memory (OOM) killer which adds an ability to kill a cgroup as a single unit to guarantee the overall integrity of the workload.

Let’s play around with cgroups and create a new one. By default, the kernel exposes cgroups in /sys/fs/cgroup. To create a new cgroup, we simply create a new sub-directory on that location:

> sudo mkdir /sys/fs/cgroup/memory/demo
> ls /sys/fs/cgroup/memory/demo
cgroup.clone_children
cgroup.event_control
cgroup.procs
memory.failcnt
memory.force_empty
memory.kmem.failcnt
memory.kmem.limit_in_bytes
memory.kmem.max_usage_in_bytes
memory.kmem.slabinfo
memory.kmem.tcp.failcnt
memory.kmem.tcp.limit_in_bytes
memory.kmem.tcp.max_usage_in_bytes
memory.kmem.tcp.usage_in_bytes
memory.kmem.usage_in_bytes
memory.limit_in_bytes
memory.max_usage_in_bytes
memory.move_charge_at_immigrate
memory.numa_stat
memory.oom_control
memory.pressure_level
memory.soft_limit_in_bytes
memory.stat
memory.swappiness
memory.usage_in_bytes
memory.use_hierarchy
notify_on_release
tasks

You can see that there are already some default values exposed there. Now, we are able to set the memory limits for that cgroup. We are also turning off swap to make our example implementation work.

> sudo su
# echo 100000000 > /sys/fs/cgroup/memory/demo/memory.limit_in_bytes
# echo 0 > /sys/fs/cgroup/memory/demo/memory.swappiness

To assign a process to a cgroup we can write the corresponding PID to the cgroup.procs file:

# echo $$ > /sys/fs/cgroup/memory/demo/cgroup.procs

Now we can execute a sample application to consume more than the allowed 100 megabytes of memory. The application I used is written in Rust and looks like this:

pub fn main() {
    let mut vec = vec![];
    loop {
        vec.extend_from_slice(&[1u8; 10_000_000]);
        println!("{}0 MB", vec.len() / 10_000_000);
    }
}

If we run the program, we see that the PID will be killed because of the set memory constraints. So our host system is still usable.

# rustc memory.rs
# ./memory
10 MB
20 MB
30 MB
40 MB
50 MB
60 MB
70 MB
80 MB
90 MB
Killed

Composing Namespaces

Namespaces are composable, too! This reveals their true power and makes it possible to have isolated pid namespaces which share the same network interface, like it is done in Kubernetes Pods.

To demonstrate this, let’s create a new namespace with an isolated PID:

> sudo unshare -fp --mount-proc
# ps aux
USER       PID %CPU %MEM    VSZ   RSS TTY      STAT START   TIME COMMAND
root         1  0.1  0.6  18688  6904 pts/0    S    23:36   0:00 -bash
root        39  0.0  0.1  35480  1836 pts/0    R+   23:36   0:00 ps aux

The setns(2) syscall with its appropriate wrapper program nsenter can now be used to join the namespace. For this we have to find out which namespace we want to join:

> export PID=$(pgrep -u root bash)
> sudo ls -l /proc/$PID/ns

Now, it is easily possible to join the namespace via nsenter:

> sudo nsenter --pid=/proc/$PID/ns/pid unshare --mount-proc
# ps aux
root         1  0.1  0.0  10804  8840 pts/1    S+   14:25   0:00 -bash
root        48  3.9  0.0  10804  8796 pts/3    S    14:26   0:00 -bash
root        88  0.0  0.0   7700  3760 pts/3    R+   14:26   0:00 ps aux

We can now see that we are member of the same PID namespace! It is also possible to enter already running containers via nsenter, but this topic will be covered later on.

Demo Application

A small demo application can be used to create a simple isolated environment via the namespace API:

#define _GNU_SOURCE
#include <errno.h>
#include <sched.h>
#include <stdio.h>
#include <string.h>
#include <sys/mount.h>
#include <sys/msg.h>
#include <sys/stat.h>
#include <sys/types.h>
#include <sys/wait.h>
#include <unistd.h>

#define STACKSIZE (1024 * 1024)
static char stack[STACKSIZE];

void print_err(char const * const reason)
{
    fprintf(stderr, "Error %s: %s\n", reason, strerror(errno));
}

int exec(void * args)
{
    // Remount proc
    if (mount("proc", "/proc", "proc", 0, "") != 0) {
        print_err("mounting proc");
        return 1;
    }

    // Set a new hostname
    char const * const hostname = "new-hostname";
    if (sethostname(hostname, strlen(hostname)) != 0) {
        print_err("setting hostname");
        return 1;
    }

    // Create a message queue
    key_t key = {0};
    if (msgget(key, IPC_CREAT) == -1) {
        print_err("creating message queue");
        return 1;
    }

    // Execute the given command
    char ** const argv = args;
    if (execvp(argv[0], argv) != 0) {
        print_err("executing command");
        return 1;
    }

    return 0;
}

int main(int argc, char ** argv)
{
    // Provide some feedback about the usage
    if (argc < 2) {
        fprintf(stderr, "No command specified\n");
        return 1;
    }

    // Namespace flags
    const int flags = CLONE_NEWNET | CLONE_NEWUTS | CLONE_NEWNS | CLONE_NEWIPC |
                      CLONE_NEWPID | CLONE_NEWUSER | SIGCHLD;

    // Create a new child process
    pid_t pid = clone(exec, stack + STACKSIZE, flags, &argv[1]);

    if (pid < 0) {
        print_err("calling clone");
        return 1;
    }

    // Wait for the process to finish
    int status = 0;
    if (waitpid(pid, &status, 0) == -1) {
        print_err("waiting for pid");
        return 1;
    }

    // Return the exit code
    return WEXITSTATUS(status);
}

Purpose of the application is to spawn a new child process in different namespaces. Every command provided to the executable will be forwarded to the new child process. The application terminates, when the command execution is done. You can test and verify the implementation via:

> gcc -o namespaces namespaces.c
> ./namespaces ip a
1: lo: <LOOPBACK> mtu 65536 qdisc noop state DOWN group default qlen 1000
    link/loopback 00:00:00:00:00:00 brd 00:00:00:00:00:00
> ./namespaces ps aux
USER       PID %CPU %MEM    VSZ   RSS TTY      STAT START   TIME COMMAND
nobody       1  0.0  0.1  36524  1828 pts/0    R+   23:46   0:00 ps aux
> ./namespaces whoami
nobody

This is truly not a working container, but it should give you a slight feeling about how container runtimes leverage namespaces to manage containers. Feel free to use this example as a starting point for your own little experiments with the namespace API.

Putting it all Together

Do you remember the rootfs we extracted from the image within the chroot section? We can use a low level container runtime like runc to easily run a container from the rootfs:

> sudo runc run -b bundle container

If we now inspect the system namespaces, we see that runc already created mnt, uts, ipc, pid and net for us:

> sudo lsns | grep bash
4026532499 mnt         1  6409 root   /bin/bash
4026532500 uts         1  6409 root   /bin/bash
4026532504 ipc         1  6409 root   /bin/bash
4026532505 pid         1  6409 root   /bin/bash
4026532511 net         1  6409 root   /bin/bash

I will stop here and we will learn more about container runtimes and what they do, in upcoming blog posts and talks.

Conclusion

I really hope you enjoyed the read and that the mysteries about containers are now a little bit more fathomable. If you run Linux it is easy to play around with different isolation techniques from scratch. In the end a container runtime nicely uses all these isolation features on different abstraction levels to provide a stable and robust development and production platform for containers.

There are lots of topics which were not covered here because I wanted to stay at a stable level of detail. For sure, a great resource for digging deeper into the topic of Linux namespaces is the Linux programmers manual: NAMESPACES(7).

Feel free to drop me a line or get in contact with me for any questions or feedback. The next blog posts will cover container runtimes, security and the overall ecosystem around latest container technologies. Stay tuned!

You can find all necessary resources about this series on GitHub.

Apache server-status

To the uninitiated, the mod_status output can look like so much gobbledegook, but it’s really quite straightforward. Let’s take a look at some sample output.

Apache Server Status for somedomain.com
Server Version: Apache/1.3.9 (Unix) PHP/4.0b3 
Server Built: Mar 4 2000 17:01:01

The first few lines identify and provide a brief description of your server. The server version information includes an incomplete list of some of the modules compiled into your server. Our example server is running on a Unix system and has been compiled with support for the PHP scripting language. (The level of detail provided by the server version line may be limited by the ServerTokens configuration directive.)

Current Time: Thursday, 13-Apr-2000 17:22:36 PDT
Restart Time: Thursday, 13-Apr-2000 17:15:26 PDT
Parent Server Generation: 14
Server uptime: 7 minutes 10 seconds
Total accesses: 42 - Total Traffic: 187 kB
CPU Usage: u.1 s.1 cu0 cs0 - .0465% CPU load
.0977 requests/sec - 445 B/second - 4559 B/request
3 requests currently being processed, 5 idle servers

The next block represents the server’s current state. Our example server has only been up for a few minutes and hasn’t yet seen much activity. It is currently dealing with three requests, one of which is my request for the server status itself. The message that five servers are idle servers is a clue that this server is configured to maintain a pool of at least five spare child processes ready to spring into action should the need arise.

K___K_W_........................................................
................................................................
................................................................
................................................................

Scoreboard Key:
   "_" Waiting for Connection, "S" Starting up, "R" Reading Request,
   "W" Sending Reply, "K" KeepAlive (read), "D" DNS Lookup, "L" Logging,
   "G" Gracefully finishing, "." Open slot with no current process

No, that’s not boring morse-code; it’s the “scoreboard,” a pseudo-graphical representation of the state of the server’s child processes. According to the included Scoreboard Key, our server is replying to one request, maintaining two KeepAlive connections, and is maintaining five idle processes. A busier server’s scoreboard would look more like:


WWKW__WW_KKKWK__KKKKWKKKKK_WKKK_KK__KRWKKK__KK___K____WKK__KWWKK
_K___K___WWKWWW_W_W_WWWK_WW_WWWLWWW_KWWKKWKWWKWWKKWW_KWKKKKW__WK
WKWWW_KKWKKKWK_KW_KKKK__KK_KKKWWK_KW__K_KKK_K..........W........
................................................................

For more on pool regulation and KeepAlive, see my earlier HTTP Wrangler column, “An Amble Through Apache Configuration.”

Srv  PID   Acc     M CPU  SS Req Conn Child Slot
0-14 29987 0/24/24 W 0.09 2  0   0.0  0.16  0.16

Client     VHost Request     Request
127.0.0.1  www.mydomain.net  GET /server-status HTTP/1.0

In addition to a more general overview of your server’s activity, mod_status gets down to the nitty-gritty, displaying a snapshot of the individual requests it is currently handling. Let’s take a gander at a fairly representative request. Please note that the output above has been split in half for display purposes.

0-14 Srv
The ID of the child process and its generation. The generation increases each time a child process is restarted, whether due to a server-restart or a limit placed on the number of processes a child is allowed to handle. See the MaxRequestsPerChild directive.
29987 PID
The child’s process ID.
0/24/24 Acc
The first number in this trio is the number of accesses or requests using this connection. For non-KeepAlive connections, this will be 0 since each request makes its own connection and so is always the first (and last). The second is the number of requests handled thus far by this child. The third is the number of requests handled by this slot; the child may have come and gone, its slot taken by another.
W Mode
The child’s mode of operation; one of the following possibilities:

"_" Waiting for Connection, "S" Starting up, 
"R" Reading Request, "W" Sending Reply,
 "K" KeepAlive (read), 
"D" DNS Lookup, "L" Logging, "G" Gracefully finishing, 
"." Open slot with no current process
0.09
2
0
0.0
0.16
0.16
CPU SS Req Conn Child Slot
Some of the less useful bits and pieces…

CPU: The child’s CPU usage in number of seconds.
SS: Seconds elapsed since the beginning of the request.
Req: Milliseconds taken to process the request.
Conn: Kilobytes transferred across this connection.
Child: Megabytes transferred by this child process.
Slot: Megabytes transferred by this slot, across children.

www.mydomain.net VHost
Perhaps your server hosts multiple virtual domains; how would you determine which page is being requested by GET /index.html?. The VHost column helps you sort out which request is coming to which virtual host — in this example, www.mydomain.net.
GET /server-status HTTP/1.0 Request
This particular hit is my request for server-status. The GET bit indicates a simple request for a document (as opposed to sending data to the server using POST). The browser (in this case the Unix command-line wget program) is using HTTP version 1.0.

For more on HTTP, see my earlier HTTP Wrangler column, “Introducing Apache.”

Installation

So how do you install and configure mod_status? I make the assumption here that you built and installed Apache from source. If you’re not familiar with building Apache, may I suggest you read my earlier HTTP Wrangler column, Getting, Installing, and Running Apache.

First, move into your Apache source directory.

% cd /usr/local/src/apache_1.3.x

Thankfully Apache’s configure script creates a cache file, config.status, saving us the bother of completely reconfiguring our Apache build from scratch. All we need to do is run config.status, supplying the one argument necessary to add mod_status.

If you’ve not already done so, now would be the time to become root.

# ./config.status --enable-module=status
Configuring for Apache, Version 1.3.11
...
Creating Makefile
Creating Configuration.apaci in src
Creating Makefile in src
 + configured for Linux platform
 + setting C compiler to gcc
 + setting C pre-processor to gcc -E
 + checking for system header files
 + adding selected modules
 + checking sizeof various data types
 + doing sanity check on compiler and options
...
Creating Makefile in src/modules/standard

Note: Apache’s configure script automagically updates config.status to include mod_status; next time you configure you will not need to enable mod_status again.

Now that we’ve reconfigured Apache, let’s rebuild.

# make

Your screen should look something like:

# make
===&amp;gt; src
make[1]: Entering directory `src/httpd/apache_1.3.11'
make[2]: Entering directory `src/httpd/apache_1.3.11/src'
===&amp;gt; src/regex
...
[several unsightly lines later]
...
gcc  -DLINUX=2 -DUSE_HSREGEX -DUSE_EXPAT -I../lib/expat-lite 
-DNO_DL_NEEDED `../apaci` -o ab   -L../os/unix -L../ap ab.o 
-lap -los  -lm -lcrypt
make[2]: Leaving directory `src/httpd/apache_1.3.11/src/support'
&amp;lt;=== src/support
make[1]: Leaving directory `src/httpd/apache_1.3.11'
&amp;lt;=== src
#

Finally, you’re ready to install your newly freshly built Apache.

# make install

(While not strictly necessary — reinstalling should only overwrite files that probably haven’t changed since your last install — I always advise backing up your Apache directory.)

Configuration

Mod_status is easy to configure; in fact the directives already exist in your httpd.conf file and simply need to be uncommented and edited slightly. If you’re not familiar with Apache configuration, may I suggest you read my earlier HTTP Wrangler column, An Amble Through Apache Configuration.

# cd /usr/local/apache/conf

(or wherever your Apache installation’s configuration files are located)

Open your httpd.conf file in the text editor of your choice and search for the following set of configuration directives:

# Allow server status reports, with the URL of http://servername/server-status
# Change the ".your_domain.com" to match your domain to enable.
#
#<Location /server-status>
#    SetHandler server-status
#    Order deny,allow
#    Deny from all
#    Allow from .your_domain.com
#</Location>

Uncomment everything from &amp;lt;Location /server-status&amp;gt; to &amp;lt;/Location&amp;gt; by removing the # characters from the beginning of each line.

It’s wise to protect your server-status output from prying eyes. The easiest way to do this is to restrict its access to one computer or domain. Change the .your_domain.com to the name of a computer or domain you wish to allow a peek at server-status. For example, if you’re the webmaven for your server, you may want to allow only your computer,mycomputer.mydomain.org access, your server-status configuration would look something like:

# Allow server status reports, with the URL of http://servername/server-status
# Change the ".your_domain.com" to match your domain to enable.
#
<Location /server-status>
    SetHandler server-status
    Order deny,allow
    Deny from all
    Allow from mycomputer.mydomain.org
</Location>

Only one tiny piece left. The default status display isn’t as detailed as what you I showed you above. The more abbreviated version looks something like:

PID Key:
   29955 in state: _ ,   29956 in state: _ ,   29957 in state: _
   29958 in state: _ ,   29959 in state: W ,   29978 in state: _

In order to see all the gory details, you need to enable “full” status. Find the following lines and uncomment (remove the initial #) the ExtendedStatus directive; the result should look like:

# ExtendedStatus controls whether Apache will generate "full" status
# information (ExtendedStatus On) or just basic information (ExtendedStatus
# Off) when the "server-status" handler is called. The default is Off.
#
ExtendedStatus On

That’s all there is to mod_status configuration. Save your httpd.conf file, shut down and start Apache.

# /usr/local/apache/sbin/apachectl stop
/usr/local/apache/sbin/apachectl stop: httpd stopped
# /usr/local/apache/sbin/apachectl start
/usr/local/apache/sbin/apachectl start: httpd started
#

Fire up your Web browser on a machine allowed access to your server’s server-status and point it at the URL:

http://servername/server-status

Happy reading! For more information on mod_status and other aspects of Apache we touched on along the way, visit the Resources section below.

Logging the php mail function

From php version 5.3.0 we can use the directive mail.log to log who’s calling the function mail(). When someone calls the function mail() from a php script we can get some info about the sender in our log.

I will enable logging globally. You can choose yourself where to activate it, editing your php.ini for cli, cgi, apache2, fpm…

To enable it globally:

sudo echo “mail.log = /var/log/phpmail.log” > /etc/php5/conf.d/mail.ini

phpmail.log is the log filename used in my example. Then create the file:

touch /var/log/phpmail.log

chmod 777 /var/log/phpmail.log

…and restart apache or process manager you are using:

/etc/init.d/apache2 restart

or

/etc/init.d/php5-fpm restart

Troubleshooting High I/O Wait in Linux

Linux has many tools available for troubleshooting some are easy to use, some are more advanced.

I/O Wait is an issue that requires use of some of the more advanced tools as well as an advanced usage of some of the basic tools. The reason I/O Wait is difficult to troubleshoot is due to the fact that by default there are plenty of tools to tell you that your system is I/O bound, but not as many that can narrow the problem to a specific process or processes.

Answering whether or not I/O is causing system slowness

To identify whether I/O is causing system slowness you can use several commands but the easiest is the unix command top.

 # top
 top - 14:31:20 up 35 min, 4 users, load average: 2.25, 1.74, 1.68
 Tasks: 71 total, 1 running, 70 sleeping, 0 stopped, 0 zombie
 Cpu(s): 2.3%us, 1.7%sy, 0.0%ni, 0.0%id, 96.0%wa, 0.0%hi, 0.0%si, 0.0%st
 Mem: 245440k total, 241004k used, 4436k free, 496k buffers
 Swap: 409596k total, 5436k used, 404160k free, 182812k cached

From the CPU(s) line you can see the current percentage of CPU in I/O Wait; The higher the number the more cpu resources are waiting for I/O access.

wa -- iowait
 Amount of time the CPU has been waiting for I/O to complete.

Finding which disk is being written to

The above top command shows I/O Wait from the system as a whole but it does not tell you what disk is being affected; for this we will use the iostat command.

 $ iostat -x 2 5
 avg-cpu: %user %nice %system %iowait %steal %idle
  3.66 0.00 47.64 48.69 0.00 0.00

 Device: rrqm/s wrqm/s r/s w/s rkB/s wkB/s avgrq-sz avgqu-sz await r_await w_await svctm %util
 sda 44.50 39.27 117.28 29.32 11220.94 13126.70 332.17 65.77 462.79 9.80 2274.71 7.60 111.41
 dm-0 0.00 0.00 83.25 9.95 10515.18 4295.29 317.84 57.01 648.54 16.73 5935.79 11.48 107.02
 dm-1 0.00 0.00 57.07 40.84 228.27 163.35 8.00 93.84 979.61 13.94 2329.08 10.93 107.02

The iostat command in the example will print a report every 2 seconds for 5 intervals; the -x tells iostat to print out an extended report.

The 1st report from iostat will print statistics based on the last time the system was booted; for this reason in most circumstances the first report from iostat should be ignored. Every sub-sequential report printed will be based on the time since the previous interval. For example in our command we will print a report 5 times, the 2nd report are disk statistics gathered since the 1st run of the report, the 3rd is based from the 2nd and so on.

In the above example the %utilized for sda is 111.41% this is a good indicator that our problem lies with processes writing to sda. While the test system in my example only has 1 disk this type of information is extremely helpful when the server has multiple disks as this can narrow down the search for which process is utilizing I/O.

Aside from %utilized there is a wealth of information in the output of iostat; items such as read and write requests per millisecond(rrqm/s & wrqm/s), reads and writes per second (r/s & w/s) and plenty more. In our example our program seems to be read and write heavy this information will be helpful when trying to identify the offending process.

Finding the processes that are causing high I/O

iotop

 # iotop
 Total DISK READ: 8.00 M/s | Total DISK WRITE: 20.36 M/s
  TID PRIO USER DISK READ DISK WRITE SWAPIN IO> COMMAND
 15758 be/4 root 7.99 M/s 8.01 M/s 0.00 % 61.97 % bonnie++ -n 0 -u 0 -r 239 -s 478 -f -b -d /tmp

The simplest method of finding which process is utilizing storage the most is to use the command iotop. After looking at the statistics it is easy to identify bonnie++ as the process causing the most I/O utilization on this machine.

While iotop is a great command and easy to use, it is not installed on all (or the main) Linux distributions by default; and I personally prefer not to rely on commands that are not installed by default. A systems administrator may find themselves on a system where they simply cannot install the non-defualt packages until a scheduled time which may be far too late depending on the issue.

If iotop is not available the below steps will also allow you to narrow down the offending process/processes.

Process list “state”

The ps command has statistics for memory and cpu but it does not have a statistic for disk I/O. While it may not have a statistic for I/O it does show the processes state which can be used to indicate whether or not a process is waiting for I/O.

The ps state field provides the processes current state; below is a list of states from the man page.

PROCESS STATE CODES
 D uninterruptible sleep (usually IO)
 R running or runnable (on run queue)
 S interruptible sleep (waiting for an event to complete)
 T stopped, either by a job control signal or because it is being traced.
 W paging (not valid since the 2.6.xx kernel)
 X dead (should never be seen)
 Z defunct ("zombie") process, terminated but not reaped by its parent.

Processes that are waiting for I/O are commonly in an “uninterruptible sleep” state or “D”; given this information we can simply find the processes that are constantly in a wait state.

Example:

 # for x in `seq 1 1 10`; do ps -eo state,pid,cmd | grep "^D"; echo "----"; sleep 5; done
 D 248 [jbd2/dm-0-8]
 D 16528 bonnie++ -n 0 -u 0 -r 239 -s 478 -f -b -d /tmp
 ----
 D 22 [kswapd0]
 D 16528 bonnie++ -n 0 -u 0 -r 239 -s 478 -f -b -d /tmp
 ----
 D 22 [kswapd0]
 D 16528 bonnie++ -n 0 -u 0 -r 239 -s 478 -f -b -d /tmp
 ----
 D 22 [kswapd0]
 D 16528 bonnie++ -n 0 -u 0 -r 239 -s 478 -f -b -d /tmp
 ----
 D 16528 bonnie++ -n 0 -u 0 -r 239 -s 478 -f -b -d /tmp
 ----

The above for loop will print the processes in a “D” state every 5 seconds for 10 intervals.

From the output above the bonnie++ process with a pid of 16528 is waiting for I/O more often than any other process. At this point the bonnie++ seems likely to be causing the I/O Wait, but just because the process is in an uninterruptible sleep state does not necessarily prove that it is the cause of I/O wait.

To help confirm our suspicions we can use the /proc file system. Within each processes directory there is a file called “io” which holds the same I/O statistics that iotop is utilizing.

 # cat /proc/16528/io
 rchar: 48752567
 wchar: 549961789
 syscr: 5967
 syscw: 67138
 read_bytes: 49020928
 write_bytes: 549961728
 cancelled_write_bytes: 0

The read_bytes and write_bytes are the number of bytes that this specific process has written and read from the storage layer. In this case the bonnie++ process has read 46 MB and written 524 MB to disk. While for some processes this may not be a lot, in our example this is enough write and reads to cause the high i/o wait that this system is seeing.

Finding what files are being written too heavily

The lsof command will show you all of the files open by a specific process or all processes depending on the options provided. From this list one can make an educated guess as to what files are likely being written to often based on the size of the file and the amounts present in the “io” file within /proc.

To narrow down the output we will use the -p <pid> options to print only files open by the specific process id.

 # lsof -p 16528
 COMMAND PID USER FD TYPE DEVICE SIZE/OFF NODE NAME
 bonnie++ 16528 root cwd DIR 252,0 4096 130597 /tmp
 <truncated>
 bonnie++ 16528 root 8u REG 252,0 501219328 131869 /tmp/Bonnie.16528
 bonnie++ 16528 root 9u REG 252,0 501219328 131869 /tmp/Bonnie.16528
 bonnie++ 16528 root 10u REG 252,0 501219328 131869 /tmp/Bonnie.16528
 bonnie++ 16528 root 11u REG 252,0 501219328 131869 /tmp/Bonnie.16528
 bonnie++ 16528 root 12u REG 252,0 501219328 131869 <strong>/tmp/Bonnie.16528</strong>

To even further confirm that these files are being written to the heavily we can see if the /tmp filesystem is part of sda.

 # df /tmp
 Filesystem 1K-blocks Used Available Use% Mounted on
 /dev/mapper/workstation-root 7667140 2628608 4653920 37% /

From the output of df we can determine that /tmp is part of the root logical volume in the workstation volume group.

 # pvdisplay
  --- Physical volume ---
  PV Name /dev/sda5
  VG Name workstation
  PV Size 7.76 GiB / not usable 2.00 MiB
  Allocatable yes
  PE Size 4.00 MiB
  Total PE 1986
  Free PE 8
  Allocated PE 1978
  PV UUID CLbABb-GcLB-l5z3-TCj3-IOK3-SQ2p-RDPW5S

Using pvdisplay we can see that the /dev/sda5 partition part of the sda disk is the partition that the workstation volume group is using and in turn is where /tmp exists. Given this information it is safe to say that the large files listed in the lsof above are likely the files being read & written to frequently.

Deframmenta per ottimizzare le tabelle di MySQL

In MySQL, quando si eliminano record da una tabella, lo spazio è riassegnato automaticamente. E ‘come uno spazio vuoto e formando gli allegati nuovi vantaggio.

Il problema è che se una tabella di eseguire molte operazioni di DELETE, lo spazio fisico del tavolo sarà sempre più frammentato e il rendimento è ridotto.

Nel MyISAM InnoDBOPTIMIZE TABLE comando disponibile ad effettuare l’ottimizzazione su qualsiasi tabella che, tra l’altro, esegue una deframmentazione automatica del tavolo.

Si consiglia vivamente di utilizzare questo comando regolarmente in particolare su tabelle che sono più le dichiarazioni di smaltimento dei record.

Per precauzione, di tenere presente che durante l’esecuzione, naturalmente, la tabella è bloccato. Si deve ricordare quando si sta per l’utilizzo con tabelle di grandi dimensioni e occupato.

La sintassi è la seguente:

OPTIMIZE [NO_WRITE_TO_BINLOG | LOCAL] TABLE mi_tabla1 [, mi_tabla2] ...;

Per fare un tavolo di ottimizzazione frammentati possono essere selezionati per avere spazio libero, probabilmente a causa di DELETE:

SELECT TABLE_SCHEMA,TABLE_NAME
FROM TABLES WHERE TABLE_SCHEMA NOT IN ("information_schema","mysql") AND
Data_free > 0

Un semplice script per deframmentare in automatico : 

#!/bin/bash

# Get a list of all fragmented tables
FRAGMENTED_TABLES="$( mysql -e 'use information_schema; SELECT TABLE_SCHEMA,TABLE_NAME \
FROM TABLES WHERE TABLE_SCHEMA NOT IN ("information_schema","mysql") AND \
Data_free > 0' | grep -v "^+" | sed "s,\t,.," )"

for fragment in $FRAGMENTED_TABLES; do
   database="$( echo $fragment | cut -d. -f1 )"
   table="$( echo $fragment | cut -d. -f2 )"
   [ $fragment != "TABLE_SCHEMA.TABLE_NAME" ] && mysql -e "USE $database;\
   OPTIMIZE TABLE $table;" > /dev/null 2>&1
done