Techniques for Scaling Applications with a Database

Applications grow. As an application attracts more users, so do the databases that store the information created, whether that’s sales transactions or scientific data gathered. Larger datasets require more resources to store and process that data. Plus, with more simultaneous users using the system, the database needs more resources.

When your application becomes popular, it needs to scale to meet the demand. Nobody sticks around if an application is slow — not willingly, anyway.

If you need to scale, celebrate it as a good problem! But that doesn’t make the process simple. Scaling has multiple possible options, each requiring different levels of sophistication. Here, we cover scaling both as a generic challenge and specifically for Redis databases, with attention to advanced scaling using Redis Enterprise.

Scaling Concepts

Scaling is a multidimensional problem with several distinct solutions.

Vertical scaling involves increasing a database’s resources. Typically, this involves moving the database to a more powerful computer or to a larger instance type.

“More” is the key word. As with any hardware choice, you consider more powerful processors, more memory and/or more network bandwidth. You have to find a balance between them that optimally improves the database’s performance and the number of simultaneous users it can support, not to mention optimizing your hardware budget.

One element in vertical scaling is adjusting the amount of RAM available to the database. In the case of Redis, RAM limits the amount of data that the database can store, so it’s an important consideration.

Vertical scaling is colloquially called scaling up or scaling down, depending on whether you move up to a more powerful computer or (in rare circumstances) shift down to a less powerful computer.

Redis provides a competitive edge to any business by delivering open source and enterprise-grade data platforms to power applications that drive real-time experiences at any scale. Developers rely on Redis to build performance, scalability, reliability, and security into their applications.

Learn More

THE LATEST FROM REDIS

Setting New Benchmark in Partner Enablement

23 February 2023
Redis Enterprise 6.4.2 Highlights Client Validation and Access Management Features
23 February 2023
Techniques for Scaling Applications with a Database
22 February 2023

Horizontal scaling involves adding additional computer nodes to a cluster of instances that operate the database, without changing the size or capacity of any individual node. Horizontal scaling is also called scaling out (when you add nodes) or scaling in (when you decrease the number of nodes).

Depending on how it’s implemented, horizontal scaling can also improve the database’s overall reliability. It eliminates a single point of failure because you are increasing the number of nodes that can be used in failover situations. However, horizontal scaling also increases time and effort (and thus costs), because you need more nodes (and hence more failure points) to keep the database functional.

In other words, vertical scaling increases the size and computing power of a single instance or node, while horizontal scaling changes the number of nodes or instances.

Vertical scaling is an easy way to improve database performance, assuming that you have or can acquire a larger computer or instance. It typically can be implemented easily in the cloud, with no impact on the application or database architecture.

Complexity isn’t a bad thing when it’s the right choice, as long as you know what you are doing.

When done correctly, horizontal scaling gives your database and your application significantly more room to grow. This scheme has plenty of history in responding to performance bottlenecks: Just throw more hardware at it!

However, horizontal scaling typically is harder to implement than vertical scaling. Adding additional nodes means more complexity. Are those nodes read-only nodes? Read/write master nodes? Active masters? Passive masters? The complexity of your database and your application architecture can increase dramatically.

Complexity isn’t a bad thing when it’s the right choice, though, as long as you know what you are doing.

There are several ways to implement horizontal scaling, each with a distinct set of advantages and disadvantages. Selecting the right model is important in building a data storage architecture. Redis supports many horizontal scaling options. Some are available in Redis open source (OSS), and some are available only in Redis Enterprise.

The Basics of Sharding

Sharding is a technique for improving a database’s overall performance, as well as increasing its storage and resource limits. It’s a relatively simple horizontal scaling technique.

With sharding, data is distributed across various partitions, or nodes. Each node holds only a portion of the data stored in the entire database. In Redis’ case, a key/value input is processed, and the data is stored in a shard.

When a request is made to the database, it is sent to a shard selector, which chooses the appropriate shard to send the request. In Redis, shard selection is often implemented by a proxy that looks at the key for the requested data, and based on the key, the proxy sends the request to the appropriate shard instance.

The shard selection algorithm is deterministic, which means every request for a given key always goes to the same shard. Only that shard has information for a given data key, as illustrated by Figure 1.

Figure 1. Horizontal scaling via sharding

Sharding is a relatively easy way to scale out a database’s capacity. By adding three shards to a Redis OSS implementation, for instance, you can nearly triple the database’s performance and triple the storage limits.

But sharding isn’t always simple. Choosing a shard selector that effectively balances traffic across all nodes may require tuning. Sharding can also lower application availability because it increases dependency on multiple instances. If you don’t manage it properly, failure of a single instance can bring down the entire database. That’ll cause a bad day at work.

Redis clustering addresses these issues, and also makes sharding easier to implement. If resharding is necessary to rebalance a database for reasons of storage capacity or performance, the data is physically moved to a new node.

An application’s awareness of the shard selector algorithm can allow the application to perform better overall balancing across the shards, though at the cost of increased complexity.

Sharding effectiveness is only as good as the shard selector algorithm that is used. An application’s awareness of the shard selector algorithm can allow the application to perform better overall balancing across the shards, though at the cost of increased complexity.

Clustering in Redis OSS is led by the cluster with the client library being cluster-aware. Essentially, the shard selector is implemented in the client library. This requires client-side support of the clustering protocol.

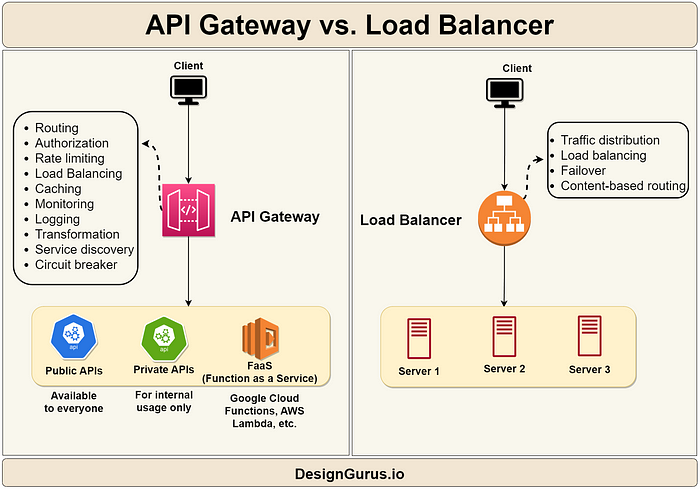
In Redis Enterprise, a server-side proxy is used to implement the shard selector and to provide support for clustering server side. The proxy acts as a load balancer of sorts between the horizontally scaled Redis instances.

Clustering is a common solution to horizontal scaling, but it has pros and cons. On the plus side, sharding is an effective way to quickly scale an application, and it is used in many large, highly scaled applications. Also, it is available out of the box.

On the other hand, clustering requires additional management. You need to know what you’re doing. Individual, large keys can create imbalances that are difficult or impossible to compensate for.

Redis clustering eliminates much of shardings’ complexities. It allows applications to focus on the data management aspects of scaling a large dataset more effectively. It improves both write and read performance.

Ultimately, how well it all works depends on the access patterns that the application uses.

Read Replicas

Another horizontal scaling option is read replicas. As the name suggests, the emphasis of read replicas is to improve the performance of reading data without regard to the time spent writing data to the database. The premise is that it is far more common to retrieve data than to change it or to add new data.

In a simple database, data is stored on a single server, and both read and write access to the data occurs on that server. With read replicas, a copy of the server’s data is stored on auxiliary servers, called read replicas. Whenever data is updated, the replicas receive updates from the primary server.

Each auxiliary server has a complete copy of the database. So when an application makes a read request, that request can go to any of the read replica servers. That means a significantly greater number of read requests can be handled simultaneously, which improves scalability and overall performance.

Read replicas cannot improve write performance, but they can increase read performance significantly.

But read replicas have limitations, depending on several factors, such as the consistency model that the database uses, or the network latency you need to contend with.

Read replicas cannot improve write performance, but they can increase read performance significantly. However, that does require you to consider how write-intensive your application is. It takes some time for a database write to the master database to propagate to the read replicas. This delay, called skew, can result in older data being returned to the application while the primary server updates the replica servers. The delay is only for a short period of time, but sometimes those delays are critical. This may or may not be an issue for your own situation, but take note of the issue as you design your system.

Think about the process of writing to a database.

  • When you update information or add new data, the write is performed to the master database instance only. That’s sacrosanct; all writes must go to the one master database instance.
  • This master instance then sends a message to all of the read replicas, indicating what data has changed in the database, and enabling the read replicas to update their copies of the data to match the master copy.

Since all database writes go through the master instance, there is no write performance improvement when additional read replicas are added. In fact, there can be a minor decrease in write performance when you add a new read replica. That’s because the master now has an additional node it must notify when a write occurs. Typically, this impact is not significant, but it’s certainly not a zero impact.

Consider the illustration in Figure 2, which shows a Redis implementation consisting of three servers. All writes to the Redis database are made to the single master database. This single master sends updates of the changed data to all the replicas. Each replica contains a complete copy of the stored Redis database.

Then, when the application wants to retrieve data, the read access to the Redis instance can occur on any server in the cluster. A load balancer takes care of routing the individual read requests, which directs traffic using one of a number of load balancing algorithms. (There are several load balancing algorithms, including round robin, least used, etc., but they are outside the scope of this discussion.)

Figure 2. Horizontal scalability with read replicas

Another benefit to using read replicas is in availability improvement. If a read replica crashes, the load balancer simply redirects traffic to another read replica. If the write master crashes, you can promote one of the read replicas to the role of master, so the system can stay operational.

Read replicas are an easy-to-implement model for horizontal scalability, and the method improves availability with little or no application impact.

Active-Active

Active-Active replication or Active-Active clustering is a way to improve performance for higher database loads.

As with read replicas, Active-Active (also called multimaster replication) relies on a database cluster with multiple nodes, with a copy of the database stored on all the nodes and a load balancer distributing the load.

With Active-Active replication, however, both read and write requests are distributed across multiple servers, and load balanced among all the nodes. The performance boost is meaningful, because a significantly larger number of requests can be handled, and they are handled faster.

Note that Active-Active replication is not supported directly by Redis OSS. If this turns out to be the appropriate scaling architecture for your needs, you’ll need Redis Enterprise. But the focus here is in explaining the computer science technique, no matter where you get it from (including building it yourself, if you have that sort of time).

With Active-Active replication, the read propagation happens exactly as described in the previous section.

When an application writes to one node, this database write is propagated to every master in the system. There are many ways this can occur, such as:

  • The application can force the write to all masters.
  • A write proxy can distribute the writes.
  • The master node that receives the write call can forward the request to other non-receiving master servers.

Figure 3 illustrates a database implementation with a cluster consisting of three servers. Each server contains a complete copy of all the data. Any server can handle any type of data request — read or write — for any data in the database.

Figure 3. Active-Active replication

When the load balancer directs a write request to the database master instance, such as in this example, it sends the update to all the other replicated instances. If a write is sent to any of the other nodes, that node sends the update to all the other replicated instances in a similar manner.

But what happens when two requests are sent to update the same data value?

In a single-node database, the requests are serialized and the changes take place in order, with the last change typically overriding previous changes.

In the Active-Active model, though, the two requests could come to different masters. The masters could then send conflicting update messages to the other master servers. This is called a write conflict.

In the case of a write conflict, the application needs to determine which database-write to keep and which to reject. That requires a resolution algorithm of some type, involving application logic or database rules.

Additionally, since updates are sent to each node asynchronously, it’s possible for data lag to cause one node to go slightly out of sync with another node. That’s an issue even when that mismatch is only for a short period of time. Developers have to take care that the application considers this potential lag so that it does not affect operations. This is similar to the issues with read replicas, but is potentially more complex.

Besides improving performance, this model of horizontal scalability also increases overall database availability. If a single node fails, the other nodes can take up the slack. However, since each node contains a complete copy of the data, this has no impact on the storage limit of a database by adding additional servers.

The cost of this model is increased application complexity in dealing with conflicting data.

Redis Enterprise’s Active-Active Geo-Distribution

Redis OSS does not natively support multimaster redundancy in any form.

However, Redis Enterprise does Active-Active Geo-Distribution, which provides Active-Active multimaster redundancy.

Then Redis Enterprise’s Active-Active Geo-Distribution goes one step further. It enables individual clusters to be located in geographically distributed locations yet replicate data between them. Take a look at Figure 4.

Figure 4. Active-Active replication across geography

This allows a Redis database to be geographically distributed to support software instances running in different geographic locations.

In this model, multiple master database instances are in different data centers. Those can be located across different regions and around the world. Individual consumers, via the application, connect to the Redis database instance that is nearest to their geographic location. The Active-Active Redis database instances are then synchronized in a multimaster model so that each Redis instance always has a complete and up-to-date copy of the data.

Redis Enterprise’s Active-Active Geo-Distribution has sophisticated algorithms for effectively dealing with write conflicts, including implementing conflict-free, replicated data types (CRDTs) that guarantee strong eventual consistency and make the process of replication synchronization significantly more reliable. The application still must be aware of and deal with data lag and write conflicts, so these issues don’t become a problem.

What’s Right for You?

You need to make your applications run faster and support additional burden on their databases. Fortunately, as this article demonstrates, you have plenty of options for scaling techniques. Each has a different impact on the amount of storage space available to your application and on the system resources.

The technique you ultimately choose depends on many factors, including your company’s goals, your software requirements, the skills of the people in your IT department, your application architecture and how much complexity you’re willing to take on.

To learn more about how Redis Enterprise scales databases — with more diagrams, which are always fun — consult “Linear Scaling with Redis Enterprise.”

https://thenewstack.io/techniques-for-scaling-applications-with-a-database/

Learning GIT using McDonald’s

The most lightly taken & ignored skill: Git️️⚙️

Git process

When you go to McDonald’s🍔 & order a “Double Quarter Pounder Burger with whole wheat bread bun, some extra Cheese with less tomatoes slice & extra mayonnaise with a large Coke”🍔🍶
(By the way thats a huge burger man 😂)

The moment you place Order:

🍔 The manager will shout out your order within the team🗣️

🍔 2 3 people will start separately working on your order like one on chicken patty part, one on wheat bread bun, one on veggies & one on your soft drink so on🕴🏻🕴🏻

🍔 They all will first “Pull” the latest stock they have in their respective inventory like bread, veggies, chicken patty & all.

🍔 The moment all 3 4 guys are ready with their individual task, they come at a single place with their result🤌🏻😎

🍔 They will add & merge all their results in a wrapper

🍔 Then push it in a box & boom it will be handed over to you🥳

And This is how exactaly Git concept works‍✅🎉

The moment your Team gets a Project like “Create a Calculator”

👨🏻‍💻Your Team Lead will shout out the task within the Team➕✖️➗

👨🏻‍💻 2 3 developers, will start separately working on different features of Calculator like one on Addition➕, one on Division➗ & so on.

👨🏻‍💻They will first “Pull”, at present the latest code, of your project, from Github/Bitbucket or wherever your project is stored into their local machines💻💻

👨🏻‍💻 Once all 2 3 guys, are ready with their respective task, they all will “push” their code at a single place📥

👨🏻‍💻They will “merge” all their work & boom the Calculator is ready✅🎉

Lets now dig a bit deeper on the Practical & Processing part of Git🧙🏼‍♂️⚙️

Note: Keep patience for next 3 mints and read calmly, lets start😎️

The moment you are asked to code & add a new feature in your existing project code repo, you will first

🔥Clone the code repo by command : git clone

Your company will be storing their code in a repo on Github or Bitbucket, they will create your account as well there, so login into that account, go to the code repo and use the command

🧞‍♂”️git clone https://[email protected]/sample_repo.git -b develop”
The “-b develop” will clone the develop branch, from many other branches present in your main code repo of team.

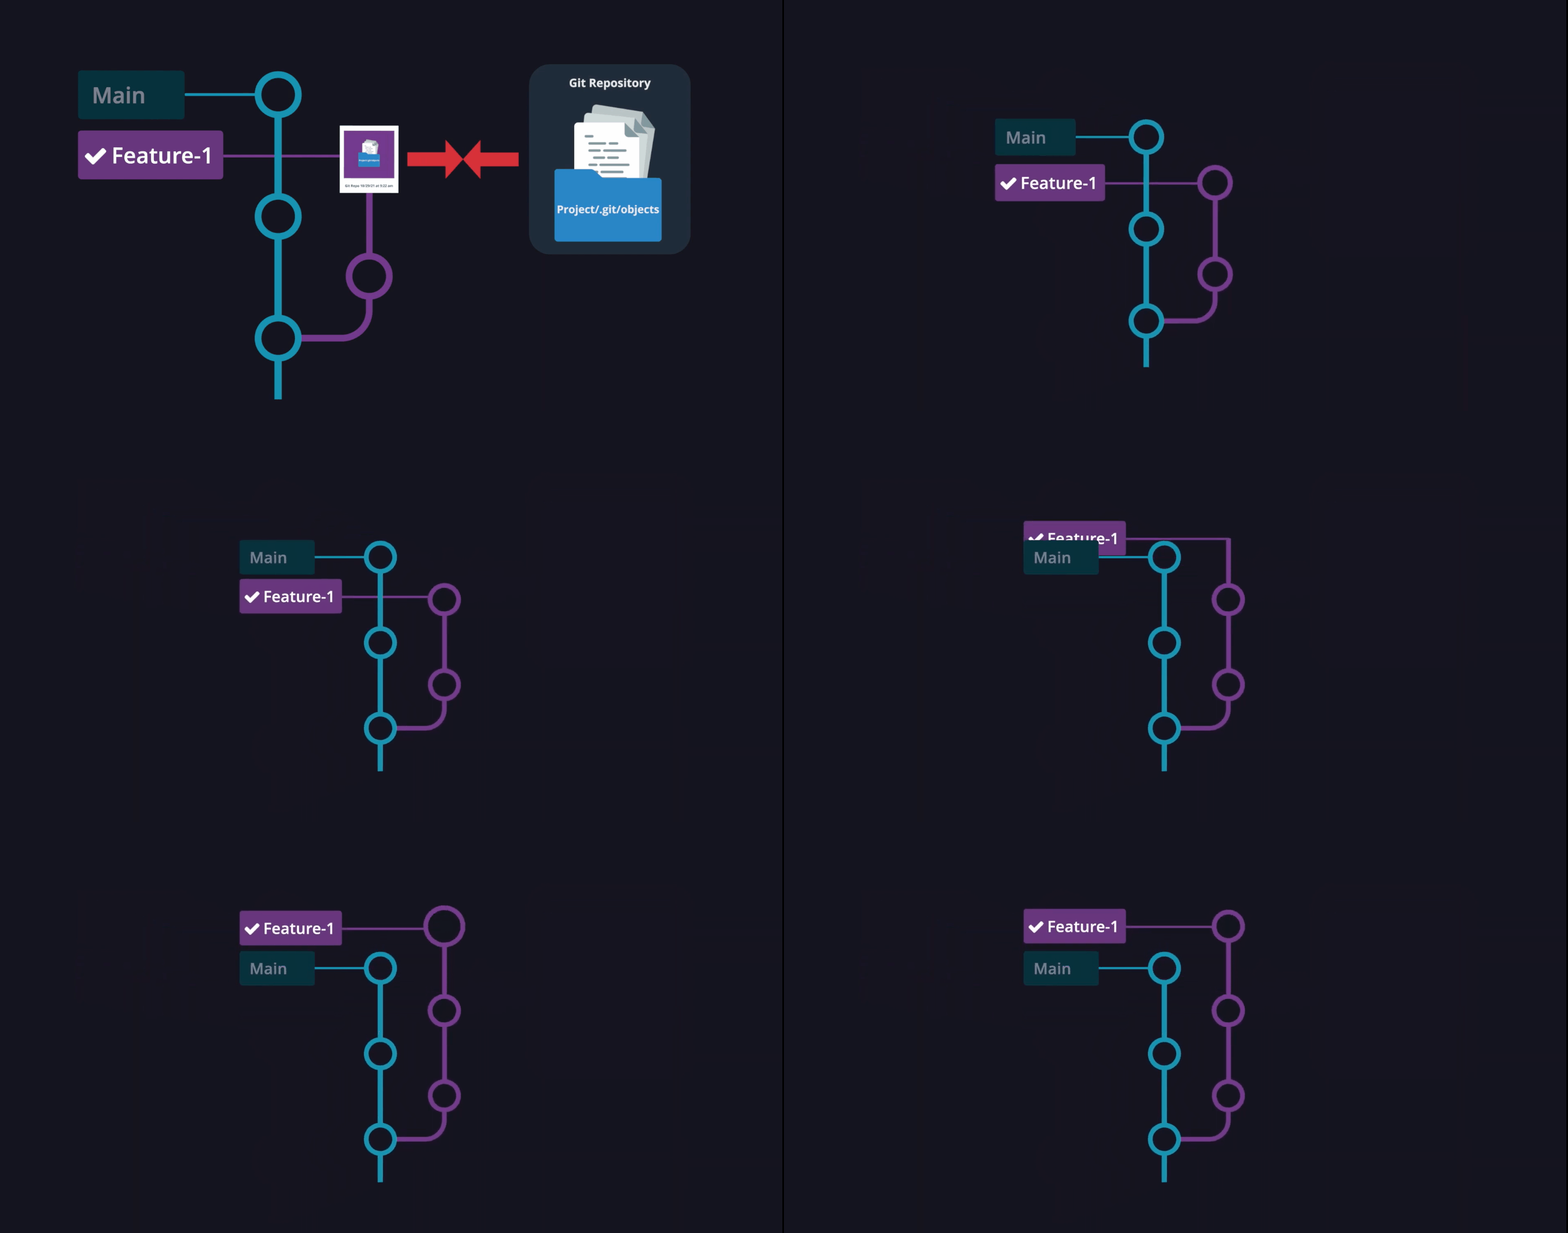
🔥Now once you have project’s develop branch code, you will create your own branch from it (like your own working space)

🧞‍♂️git checkout -b mohit/feature_calculator_addition
“mohit/feature_calculator_addition” this branch is your private space, separated from your main team project, this will help to avoid any issue, from your side, in the main code of the team.

🔥Start doing the changes or code addition you want and once done do

🧞‍♂️git status : It will show all the scripts you have made changes to.

🧞‍♂️git add a.py b.py: This will add the changed script to a staging/space where they are made ready to be now pushed to main repo.

🧞‍♂️git commit -m “added addition feature”: This will be your msg to the team for the code you have worked on.

🧞‍♂️git push origin mohit/feature_calculator_addition: This will push your entire code to the branch you have created.

🔥Till now you have taken pull of the team’s code, created your own branch, worked on it, pushed the code to “your” branch.

But all this is at “your” level till now, so to put all this, in teams code repo you will raise a “Pull Request” to your Team Lead.

🔥Login to your Bitbucket/Github console -> Go to Pull Request tab,
select from where to where you want to move your code.
From: mohit/feature_calculator_addition To: Develop

🔥Once you raise the PR, by adding your team lead name, he will be notified & he can see your changes in all those scripts you have made.

🔥If he/she feels it’s proper, lead will accept your code & merge it in the teams’s develop branch or else he will reject it with a message by him & you will be notified why it’s been rejected & you will do the necessary changes & will raise a PR.

PR raised to Lead Emma from Your branch to Team Branch

🔥Also when you raise a PR, there can be a scenario where you and one other team member have made changes in the exact same script in exactly the same line, now this will give a “Merge Conflict” when code will be added to the main branch🤕

Merge conflicts happen when you merge two branches that have competing/smiliar commits, and Git needs your help to decide which/whose changes to incorporate in the final merge.

🔥You have to resolve this merge conflict, by either changing the code’s position or by deciding which one of you will be keeping your code on that paticular line giving merge conflict🥶

🥳Once resolved, the final code will be added to the project’s repo code🥳

🤷🏻‍♂️Now the most asked question: What is Git and GitHub ?🙄

See Internet is a concept, on which we are making and using Whatsapp, Facebook, Gmail🤖

Same way, Git is the concept, an approach on which Github & Bitbucket have opened their shops, of giving developer a space, where we can save our code & version them, so that if by chance we have issue in our Production code, we can just rollback to our second last release code & can publish it for customer🥳

There are many more, deep down things in Git, but this article’s approach was to just give you a brief idea, about the concept of git, so that later on it will be easy for you to connect dots about git by any tutorial you like🤌🏻😎

And Thank You for being here with me and for your love🫶🏻🙌🏻
It makes me so happy 😃 seeing a clap 👏🏻 or a comment✍🏻 or seeing article shared by someone. It makes all the efforts worth 🙏🏻

So that’s all from now, hope you have enjoyed the Git burger 🍔😂 as well the concept.
Wish you all a happy learning and an awesome year ahead🥳

Why i switched form docker desktop to Colima

DDEV is an open source tool that makes it simple to get local PHP development environments up and running within minutes. It’s powerful and flexible as a result of its per-project environment configurations, which can be extended, version controlled, and shared. In short, DDEV aims to allow development teams to use containers in their workflow without the complexities of bespoke configuration.

DDEV replaces more traditional AMP stack solutions (WAMP, MAMP, XAMPP, and so on) with a flexible, modern, container-based solution. Because it uses containers, DDEV allows each project to use any set of applications, versions of web servers, database servers, search index servers, and other types of software.

In March 2022, the DDEV team announced support for Colima, an open source Docker Desktop replacement for macOS and Linux. Colima is open source, and by all reports it’s got performance gains over its alternative, so using Colima seems like a no-brainer.

Migrating to Colima

First off, Colima is almost a drop-in replacement for Docker Desktop. I say almost because some reconfiguration is required when using it for an existing DDEV project. Specifically, databases must be reimported. The fix is to first export your database, then start Colima, then import it. Easy.

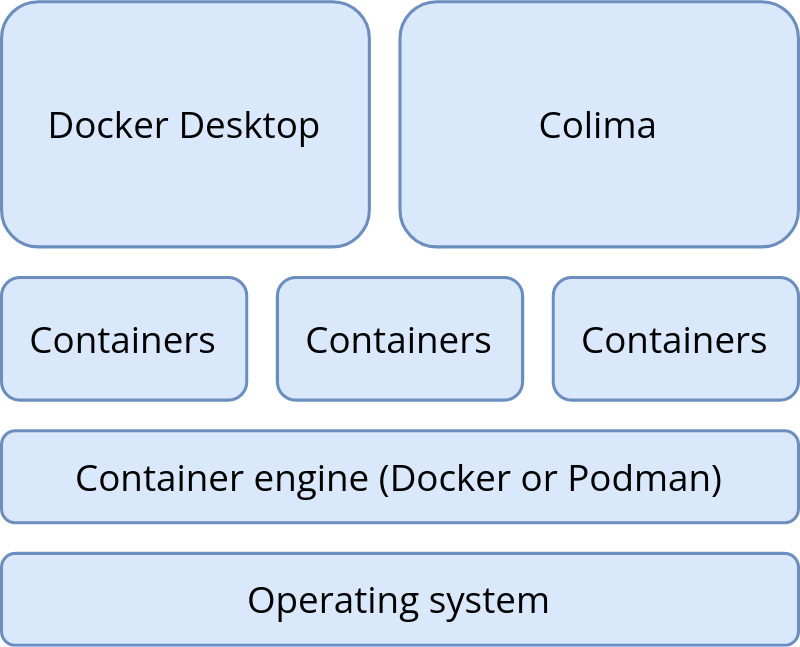
Colima requires that either the Docker or Podman command is installed. On Linux, it also requires Lima.

Docker is installed by default with Docker Desktop for macOS, but it’s also available as a stand-alone command. If you want to go 100% pure Colima, you can uninstall Docker Desktop for macOS, and install and configure the Docker client independently. Full installation instructions can be found on the DDEV docs site.

An image of the container technology stack.

(Mike Anello,CC BY-SA 4.0)

If you choose to keep using both Colima and Docker Desktop, then when issuing docker commands from the command line, you must first specify which container you want to work with. More on this in the next section.

More on Kubernetes

What is Kubernetes?

Free online course: Containers, Kubernetes and Red Hat OpenShift technical over…

eBook: Storage Patterns for Kubernetes

Test drive OpenShift hands-on

An introduction to enterprise Kubernetes

How to explain Kubernetes in plain terms

eBook: Running Kubernetes on your Raspberry Pi homelab

Kubernetes cheat sheet

eBook: A guide to Kubernetes for SREs and sysadmins

Latest Kubernetes articles

Install Colima on macOS

I currently have some local projects using Docker, and some using Colima. Once I understood the basics, it’s not too difficult to switch between them.

  1. To get started, install Colima using Homebrew brew install colima
  2. ddev poweroff (just to be safe)
  3. Next, start Colima with colima start --cpu 4 --memory 4. The --cpu and --memory options only have to be done once. After the first time, only colima start is necessary.
  4. If you’re a DDEV user like me, then you can spin up a fresh Drupal 9 site with the usual ddev commands (ddev config, ddev start, and so on.) It’s recommended to enable DDEV’s mutagen functionality to maximize performance.

Switching between a Colima and Docker Desktop

If you’re not ready to switch to Colima wholesale yet, it’s possible to have both Colima and Docker Desktop installed.

  1. First, poweroff ddev:ddev poweroff
  2. Then stop Colima: colima stop
  3. Now run docker context use default to tell the Docker client which container you want to work with. The name default refers to Docker Desktop for Mac. When colima start is run, it automatically switches Docker to the colima context.
  4. To continue with the default (Docker Desktop) context, use the ddev start command.

Technically, starting and stopping Colima isn’t necessary, but the ddev poweroff command when switching between two contexts is.

Recent versions of Colima revert the Docker context back to default when Colima is stopped, so the docker context use default command is no longer necessary. Regardless, I still use docker context show to verify that either the default (Docker Desktop for Mac) or colima context is in use. Basically, the term context refers to which container provider the Docker client routes commands to.

Try Colima

Overall, I’m liking what I see so far. I haven’t run into any issues, and Colima-based sites seem a bit snappier (especially when DDEV’s Mutagen functionality is enabled). I definitely foresee myself migrating project sites to Colima over the next few weeks.

backup restore mysql docker

# Backup
docker exec CONTAINER /usr/bin/mysqldump -u root --password=root DATABASE > backup.sql

# Restore
cat backup.sql | docker exec -i CONTAINER /usr/bin/mysql -u root --password=root DATABASE

Migrate databases to Kubernetes using Konveyor

Ships at sea on the web

Kubernetes Database Operator is useful for building scalable database servers as a database (DB) cluster. But because you have to create new artifacts expressed as YAML files, migrating existing databases to Kubernetes requires a lot of manual effort. This article introduces a new open source tool named Konveyor Tackle-DiVA-DOA (Data-intensive Validity Analyzer-Database Operator Adaptation). It automatically generates deployment-ready artifacts for database operator migration. And it does that through datacentric code analysis.

What is Tackle-DiVA-DOA?

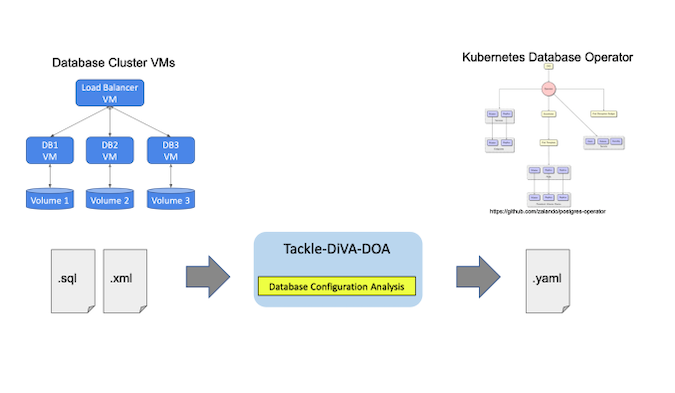
Tackle-DiVA-DOA (DOA, for short) is an open source datacentric database configuration analytics tool in Konveyor Tackle. It imports target database configuration files (such as SQL and XML) and generates a set of Kubernetes artifacts for database migration to operators such as Zalando Postgres Operator.

A flowchart shows a database cluster with three virtual machines and SQL and XML files transformed by going through Tackle-DiVA-DOA into a Kubernetes Database Operator structure and a YAML file

DOA finds and analyzes the settings of an existing system that uses a database management system (DBMS). Then it generates manifests (YAML files) of Kubernetes and the Postgres operator for deploying an equivalent DB cluster.

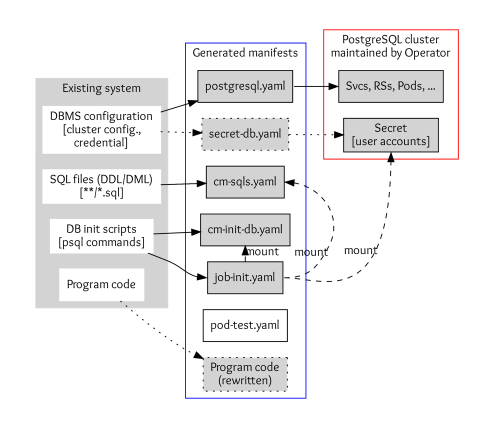
A flowchart shows the four elements of an existing system (as described in the text below), the manifests generated by them, and those that transfer to a PostgreSQL cluster

Database settings of an application consist of DBMS configurations, SQL files, DB initialization scripts, and program codes to access the DB.

  • DBMS configurations include parameters of DBMS, cluster configuration, and credentials. DOA stores the configuration to postgres.yaml and secrets to secret-db.yaml if you need custom credentials.
     
  • SQL files are used to define and initialize tables, views, and other entities in the database. These are stored in the Kubernetes ConfigMap definition cm-sqls.yaml.
     
  • Database initialization scripts typically create databases and schema and grant users access to the DB entities so that SQL files work correctly. DOA tries to find initialization requirements from scripts and documents or guesses if it can’t. The result will also be stored in a ConfigMap named cm-init-db.yaml.
     
  • Code to access the database, such as host and database name, is in some cases embedded in program code. These are rewritten to work with the migrated DB cluster.

Tutorial

DOA is expected to run within a container and comes with a script to build its image. Make sure Docker and Bash are installed on your environment, and then run the build script as follows:

cd /tmp
git clone https://github.com/konveyor/tackle-diva.git
cd tackle-diva/doa
bash util/build.sh

docker image ls diva-doa
REPOSITORY   TAG       IMAGE ID       CREATED        SIZE
diva-doa     2.2.0     5f9dd8f9f0eb   14 hours ago   1.27GB
diva-doa     latest    5f9dd8f9f0eb   14 hours ago   1.27GB

This builds DOA and packs as container images. Now DOA is ready to use.

The next step executes a bundled run-doa.shwrapper script, which runs the DOA container. Specify the Git repository of the target database application. This example uses a Postgres database in the TradeApp application. You can use the -o option for the location of output files and an -i option for the name of the database initialization script:

cd /tmp/tackle-diva/doa
bash run-doa.sh -o /tmp/out -i start_up.sh \
      https://github.com/saud-aslam/trading-app
[OK] successfully completed.

The /tmp/out/ directory and /tmp/out/trading-app, a directory with the target application name, are created. In this example, the application name is trading-app, which is the GitHub repository name. Generated artifacts (the YAML files) are also generated under the application-name directory:

ls -FR /tmp/out/trading-app/
/tmp/out/trading-app/:
cm-init-db.yaml  cm-sqls.yaml  create.sh*  delete.sh*  job-init.yaml  postgres.yaml  test//tmp/out/trading-app/test:
pod-test.yaml

The prefix of each YAML file denotes the kind of resource that the file defines. For instance, each cm-*.yamlfile defines a ConfigMap, and job-init.yamldefines a Job resource. At this point, secret-db.yaml is not created, and DOA uses credentials that the Postgres operator automatically generates.

Now you have the resource definitions required to deploy a PostgreSQL cluster on a Kubernetes instance. You can deploy them using the utility script create.sh. Alternatively, you can use the kubectl createcommand:

cd /tmp/out/trading-app
bash create.sh  # or simply “kubectl apply -f .”configmap/trading-app-cm-init-db created
configmap/trading-app-cm-sqls created
job.batch/trading-app-init created
postgresql.acid.zalan.do/diva-trading-app-db created

The Kubernetes resources are created, including postgresql (a resource of the database cluster created by the Postgres operator), servicerspodjobcmsecretpv, and pvc. For example, you can see four database pods named trading-app-*, because the number of database instances is defined as four in postgres.yaml.

$ kubectl get all,postgresql,cm,secret,pv,pvc
NAME                                        READY   STATUS      RESTARTS   AGE

pod/trading-app-db-0 1/1     Running     0          7m11s
pod/trading-app-db-1 1/1     Running     0          5m
pod/trading-app-db-2 1/1     Running     0          4m14s
pod/trading-app-db-3 1/1     Running     0          4mNAME                                      TEAM          VERSION   PODS   VOLUME   CPU-REQUEST   MEMORY-REQUEST   AGE   STATUS
postgresql.acid.zalan.do/trading-app-db   trading-app   13 4      1Gi                                     15m   RunningNAME                            TYPE        CLUSTER-IP      EXTERNAL-IP   PORT(S)    AGE
service/trading-app-db          ClusterIP   10.97.59.252    <none> 5432/TCP   15m
service/trading-app-db-repl     ClusterIP   10.108.49.133   <none> 5432/TCP   15mNAME                         COMPLETIONS   DURATION   AGE
job.batch/trading-app-init   1/1           2m39s      15m

Note that the Postgres operator comes with a user interface (UI). You can find the created cluster on the UI. You need to export the endpoint URL to open the UI on a browser. If you use minikube, do as follows:

$ minikube service postgres-operator-ui

Then a browser window automatically opens that shows the UI.

Screenshot of the UI showing the Cluster YAML definition on the left with the Cluster UID underneath it. On the right of the screen a header reads "Checking status of cluster," and items in green under that heading show successful creation of manifests and other elements

(Yasuharu Katsuno and Shin Saito, CC BY-SA 4.0)

Now you can get access to the database instances using a test pod. DOA also generated a pod definition for testing.

$ kubectl apply -f /tmp/out/trading-app/test/pod-test.yaml # creates a test Pod
pod/trading-app-test created
$ kubectl exec trading-app-test -it -- bash # login to the pod

The database hostname and the credential to access the DB are injected into the pod, so you can access the database using them. Execute the psql metacommand to show all tables and views (in a database):

# printenv DB_HOST; printenv PGPASSWORD
(values of the variable are shown)# psql -h ${DB_HOST} -U postgres -d jrvstrading -c '\dt'
             List of relations
 Schema |      Name      | Type  |  Owner  
--------+----------------+-------+----------
 public | account        | table | postgres
 public | quote          | table | postgres
 public | security_order | table | postgres
 public | trader         | table | postgres
(4 rows)# psql -h ${DB_HOST} -U postgres -d jrvstrading -c '\dv'
                List of relations
 Schema |         Name          | Type |  Owner  
--------+-----------------------+------+----------
 public | pg_stat_kcache        | view | postgres
 public | pg_stat_kcache_detail | view | postgres
 public | pg_stat_statements    | view | postgres
 public | position              | view | postgres
(4 rows)

After the test is done, log out from the pod and remove the test pod:

# exit
$ kubectl delete -f /tmp/out/trading-app/test/pod-test.yaml

Finally, delete the created cluster using a script:

$ bash delete.sh

Selecting Performance Monitoring Tools

Linux Performance Observability Tools by Brendan Gregg (CC BY-SA 4.0)

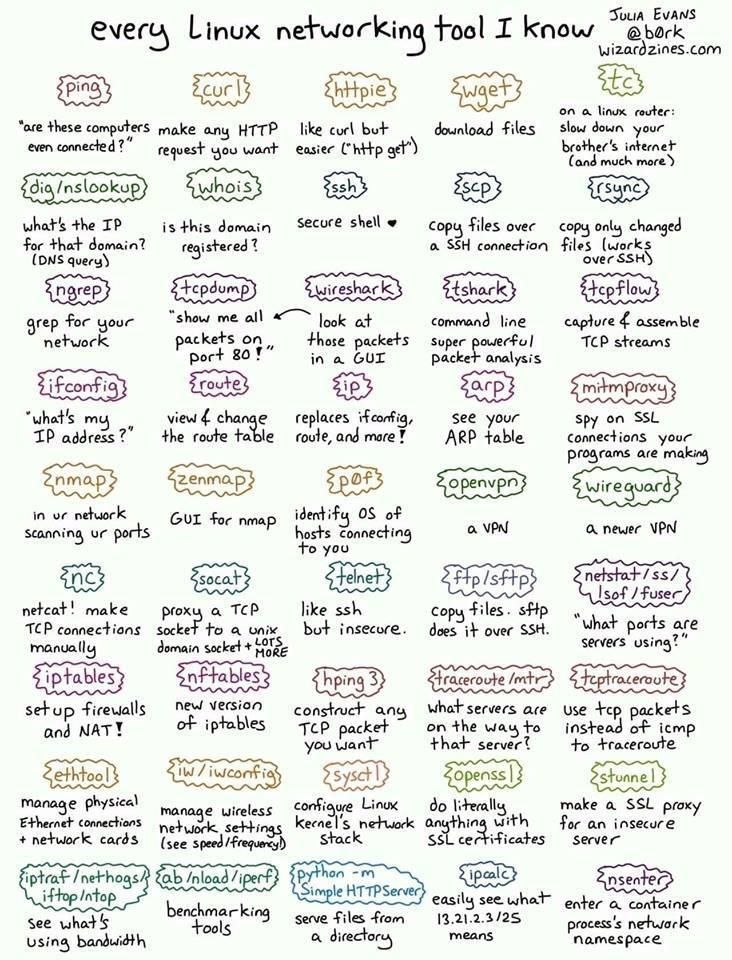
System monitoring is a helpful approach to provide the user with data regarding the actual timing behavior of the system. Users can perform further analysis using the data that these monitors provide. One of the goals of system monitoring is to determine whether the current execution meets the specified technical requirements.

These monitoring tools retrieve commonly viewed information, and can be used by way of the command line or a graphical user interface, as determined by the system administrator. These tools display information about the Linux system, such as free disk space, the temperature of the CPU, and other essential components, as well as networking information, such as the system IP address and current rates of upload and download.

Monitoring Tools

The Linux kernel maintains counterstructures for counting events, that increment when an event occurs. For example, disk reads and writes, and process system calls, are events that increment counters with values stored as unsigned integers. Monitoring tools read these counter values. These tools provide either per process statistics maintained in process structures, or system-wide statistics in the kernel. Monitoring tools are typically viewable by non-privileged users. The ps and top commands provide process statistics, including CPU and memory.

Monitoring Processes Using the ps Command

Troubleshooting a system requires understanding how the kernel communicates with processes, and how processes communicate with each other. At process creation, the system assigns a state to the process.

Use the ps aux command to list all users with extended user-oriented details; the resulting list includes the terminal from which processes are started, as well as processes without a terminal. A ? sign in the TTY column represents that the process did not start from a terminal.

[[email protected]]$ ps aux
USER   PID %CPU %MEM    VSZ   RSS TTY      STAT START TIME COMMAND
user  1350  0.0  0.2 233916  4808 pts/0    Ss   10:00   0:00 -bash
root  1387  0.0  0.1 244904  2808 ?        Ss   10:01 0:00 /usr/sbin/anacron -s
root  1410  0.0  0.0      0     0 ?        I    10:08   0:00 [kworker/0:2...
root  1435  0.0  0.0      0     0 ?        I    10:31   0:00 [kworker/1:1...
user  1436  0.0  0.2 266920  3816 pts/0    R+   10:48   0:00 ps aux

The Linux version of ps supports three option formats:

  • UNIX (POSIX) options, which may be grouped and must be preceded by a dash.
  • BSD options, which may be grouped and must not include a dash.
  • GNU long options, which are preceded by two dashes.

The output below uses the UNIX options to list every process with full details:

[[email protected]]$ ps -ef
UID        PID  PPID  C STIME TTY          TIME CMD
root         2     0  0 09:57 ?        00:00:00 [kthreadd]
root         3     2  0 09:57 ?        00:00:00 [rcu_gp]
root         4     2  0 09:57 ?        00:00:00 [rcu_par_gp]
...output omitted...

Key Columns in ps OutputPID

This column shows the unique process ID.TIME

This column shows the total CPU time consumed by the process in hours:minutes:seconds format, since the start of the process.%CPU

This column shows the CPU usage during the previous second as the sum across all CPUs expressed as a percentage.RSS

This column shows the non-swapped physical memory that a process consumes in kilobytes in the resident set size, RSS column.%MEM

This column shows the ratio of the process’ resident set size to the physical memory on the machine, expressed as a percentage.

Use the -p option together with the pidof command to list the sshd processes that are running.

[[email protected] ~]$ ps -p $(pidof sshd)
  PID TTY      STAT   TIME COMMAND
  756 ?        Ss     0:00 /usr/sbin/sshd -D [email protected]...
 1335 ?        Ss     0:00 sshd: user [priv]
 1349 ?        S      0:00 sshd: [email protected]/0

Use the following command to list of all processes sorted by memory usage in descending order:

[[email protected] ~]$ ps ax --format pid,%mem,cmd --sort -%mem
  PID %MEM CMD
  713  1.8 /usr/libexec/sssd/sssd_nss --uid 0 --gid 0 --logger=files
  715  1.8 /usr/libexec/platform-python -s /usr/sbin/firewalld --nofork --nopid
  753  1.5 /usr/libexec/platform-python -Es /usr/sbin/tuned -l -P
  687  1.2 /usr/lib/polkit-1/polkitd --no-debug
  731  0.9 /usr/sbin/NetworkManager --no-daemon
...output omitted...

Various other options are available for ps including the o option to customize the output and columns shown.

Monitoring Process Using top

The top command provides a real-time report of process activities with an interface for the user to filter and manipulate the monitored data. The command output shows a system-wide summary at the top and process listing at the bottom, sorted by the top CPU consuming task by default. The -n 1 option terminates the program after a single display of the process list. The following is an example output of the command:

[[email protected] ~]$ top -n 1
Tasks: 115 total,   1 running, 114 sleeping,   0 stopped,   0 zombie
%Cpu(s):  0.0 us,  3.2 sy,  0.0 ni, 96.8 id,  0.0 wa,  0.0 hi,  0.0 si,  0.0 st
MiB Mem :   1829.0 total,   1426.5 free,    173.6 used,    228.9 buff/cache
MiB Swap:      0.0 total,      0.0 free,      0.0 used.   1495.8 avail Mem

  PID USER      PR  NI    VIRT    RES    SHR S  %CPU  %MEM     TIME+ COMMAND
    1 root      20   0  243968  13276   8908 S   0.0   0.7   0:01.86 systemd
    2 root      20   0       0      0      0 S   0.0   0.0   0:00.00 kthreadd
    3 root       0 -20       0      0      0 I   0.0   0.0   0:00.00 rcu_gp
...output omitted...

Useful Key Combinations to Sort FieldsRES

Use Shift+M to sort the processes based on resident memory.PID

Use Shift+N to sort the processes based on process ID.TIME+

Use Shift+T to sort the processes based on CPU time.

Press F and select a field from the list to use any other field for sorting.

IMPORTANT

The top command imposes a significant overhead on the system due to various system calls. While running the top command, the process running the top command is often the top CPU-consuming process.

Monitoring Memory Usage

The free command lists both free and used physical memory and swap memory. The -b-k-m-g options show the output in bytes, KB, MB, or GB, respectively. The -s option is passed as an argument that specifies the number of seconds between refreshes. For example, free -s 1 produces an update every 1 second.

[[email protected] ~]$ free -m
              total        used        free      shared  buff/cache   available
Mem:           1829         172        1427          16         228        1496
Swap:             0           0           0

The near zero values in the buff/cache and available columns indicate a low memory situation. If the available memory is more than 20% of the total, and the used memory is close to the total memory, then these values indicate a healthy system.

Monitoring File System Usage

One stable identifier that is associated with a file system is its UUID, a very long hexadecimal number that acts as a universally unique identifier. This UUID is part of the file system and remains the same as long as the file system is not recreated. The lsblk -fp command lists the full path of the device, along with the UUIDs and mount points, as well as the type of file system in the partition. If the file system is not mounted, the mount point displays as blank.

[[email protected] ~]$ lsblk -fp
NAME        FSTYPE LABEL UUID                                 MOUNTPOINT
/dev/vda
├─/dev/vda1 xfs          23ea8803-a396-494a-8e95-1538a53b821c /boot
├─/dev/vda2 swap         cdf61ded-534c-4bd6-b458-cab18b1a72ea [SWAP]
└─/dev/vda3 xfs          44330f15-2f9d-4745-ae2e-20844f22762d /
/dev/vdb
└─/dev/vdb1 xfs          46f543fd-78c9-4526-a857-244811be2d88

The findmnt command allows the user to take a quick look at what is mounted where, and with which options. Executing the findmnt command without any options lists out all the mounted file systems in a tree layout. Use the -s option to read the file systems from the /etc/fstab file. Use the -S option to search the file systems by the source disk.

[[email protected] ~]$ findmnt -S /dev/vda1
TARGET SOURCE    FSTYPE OPTIONS
/      /dev/vda1 xfs    rw,relatime,seclabel,attr2,inode64,noquota

The df command provides information about the total usage of the file systems. The -h option transforms the output into a human-readable form.

[[email protected] ~]$ df -h
Filesystem      Size  Used Avail Use% Mounted on
devtmpfs        892M     0  892M   0% /dev
tmpfs           915M     0  915M   0% /dev/shm
tmpfs           915M   17M  899M   2% /run
tmpfs           915M     0  915M   0% /sys/fs/cgroup
/dev/vda1        10G  1.5G  8.6G  15% /
tmpfs           183M     0  183M   0% /run/user/1000

The du command displays the total size of all the files in a given directory and its subdirectories. The -s option suppresses the output of detailed information and displays only the total. Similar to the df -h command, the -h option displays the output into a human-readable form.

[[email protected] ~]$ du -sh /home/user
16K /home/user

Using GNOME System Monitor

The System Monitor available on the GNOME desktop provides statistical data about the system status, load, and processes, as well as the ability to manipulate those processes. Similar to other monitoring tools, such as the topps, and free commands, the System Monitor provides both the system-wide and per-process data. These monitoring tools retrieve commonly viewed information, and can be used by way of the command line or a graphical user interface, as determined by the system administrator. Use the gnome-system-monitor command to access the application from a command terminal.

To view the CPU usage, go to the Resources tab and look at the CPU History chart.

Figure 2.2: CPU usage history in System Monitor

The virtual memory is the sum of the physical memory and the swap space in a system. A running process maps the location in physical memory to files on disk. The memory map displays the total virtual memory consumed by a running process, which determines the memory cost of running that process instance. The memory map also displays the shared libraries used by the process.

Figure 2.3: Memory map of a process in System Monitor

To display the memory map of a process in System Monitor, locate a process in the Processes tab, right-click a process in the list, and select Memory Maps.