
System monitoring is a helpful approach to provide the user with data regarding the actual timing behavior of the system. Users can perform further analysis using the data that these monitors provide. One of the goals of system monitoring is to determine whether the current execution meets the specified technical requirements.
These monitoring tools retrieve commonly viewed information, and can be used by way of the command line or a graphical user interface, as determined by the system administrator. These tools display information about the Linux system, such as free disk space, the temperature of the CPU, and other essential components, as well as networking information, such as the system IP address and current rates of upload and download.
Monitoring Tools
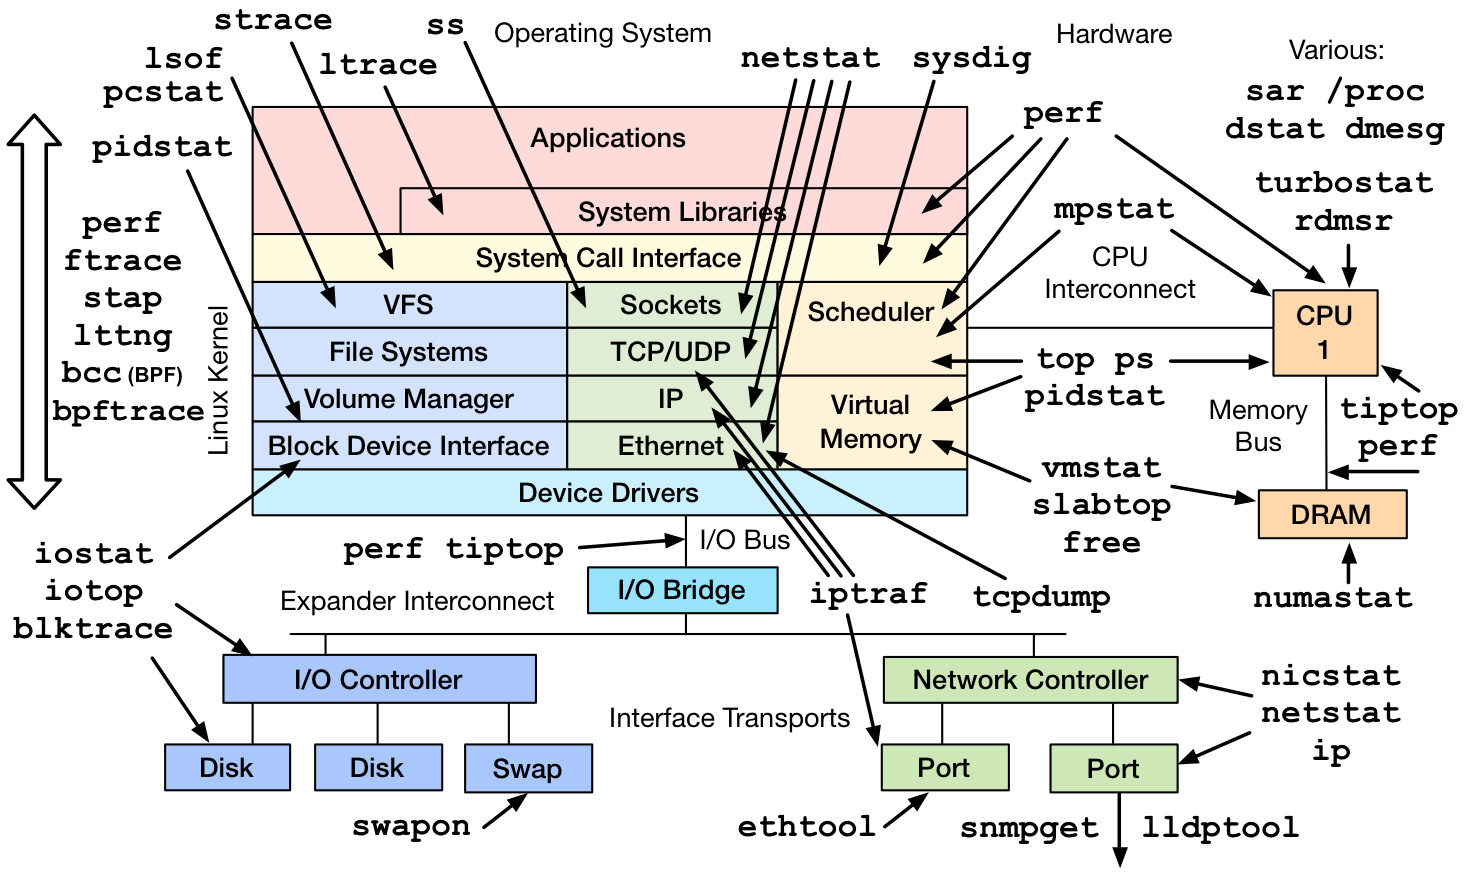
The Linux kernel maintains counterstructures for counting events, that increment when an event occurs. For example, disk reads and writes, and process system calls, are events that increment counters with values stored as unsigned integers. Monitoring tools read these counter values. These tools provide either per process statistics maintained in process structures, or system-wide statistics in the kernel. Monitoring tools are typically viewable by non-privileged users. The ps and top commands provide process statistics, including CPU and memory.
Monitoring Processes Using the ps Command
Troubleshooting a system requires understanding how the kernel communicates with processes, and how processes communicate with each other. At process creation, the system assigns a state to the process.
Use the ps aux command to list all users with extended user-oriented details; the resulting list includes the terminal from which processes are started, as well as processes without a terminal. A ? sign in the TTY column represents that the process did not start from a terminal.
[user@host]$ps auxUSER PID %CPU %MEM VSZ RSSTTYSTAT START TIME COMMAND user 1350 0.0 0.2 233916 4808 pts/0 Ss 10:00 0:00 -bash root 1387 0.0 0.1 244904 2808?Ss 10:01 0:00 /usr/sbin/anacron -s root 1410 0.0 0.0 0 0 ? I 10:08 0:00 [kworker/0:2... root 1435 0.0 0.0 0 0 ? I 10:31 0:00 [kworker/1:1... user 1436 0.0 0.2 266920 3816 pts/0 R+ 10:48 0:00 ps aux
The Linux version of ps supports three option formats:
- UNIX (POSIX) options, which may be grouped and must be preceded by a dash.
- BSD options, which may be grouped and must not include a dash.
- GNU long options, which are preceded by two dashes.
The output below uses the UNIX options to list every process with full details:
[user@host]$ps -efUID PID PPID C STIME TTY TIME CMD root 2 0 0 09:57 ? 00:00:00 [kthreadd] root 3 2 0 09:57 ? 00:00:00 [rcu_gp] root 4 2 0 09:57 ? 00:00:00 [rcu_par_gp] ...output omitted...
Key Columns in ps OutputPID
This column shows the unique process ID.TIME
This column shows the total CPU time consumed by the process in hours:minutes:seconds format, since the start of the process.%CPU
This column shows the CPU usage during the previous second as the sum across all CPUs expressed as a percentage.RSS
This column shows the non-swapped physical memory that a process consumes in kilobytes in the resident set size, RSS column.%MEM
This column shows the ratio of the process’ resident set size to the physical memory on the machine, expressed as a percentage.
Use the -p option together with the pidof command to list the sshd processes that are running.
[user@host ~]$ps -p $(pidof sshd)PID TTY STAT TIME COMMAND 756 ? Ss 0:00 /usr/sbin/sshd -D [email protected]... 1335 ? Ss 0:00 sshd: user [priv] 1349 ? S 0:00 sshd: user@pts/0
Use the following command to list of all processes sorted by memory usage in descending order:
[user@host ~]$ps ax --format pid,%mem,cmd --sort -%memPID %MEM CMD 713 1.8 /usr/libexec/sssd/sssd_nss --uid 0 --gid 0 --logger=files 715 1.8 /usr/libexec/platform-python -s /usr/sbin/firewalld --nofork --nopid 753 1.5 /usr/libexec/platform-python -Es /usr/sbin/tuned -l -P 687 1.2 /usr/lib/polkit-1/polkitd --no-debug 731 0.9 /usr/sbin/NetworkManager --no-daemon ...output omitted...
Various other options are available for ps including the o option to customize the output and columns shown.
Monitoring Process Using top
The top command provides a real-time report of process activities with an interface for the user to filter and manipulate the monitored data. The command output shows a system-wide summary at the top and process listing at the bottom, sorted by the top CPU consuming task by default. The -n 1 option terminates the program after a single display of the process list. The following is an example output of the command:
[user@host ~]$top -n 1Tasks: 115 total, 1 running, 114 sleeping, 0 stopped, 0 zombie %Cpu(s): 0.0 us, 3.2 sy, 0.0 ni, 96.8 id, 0.0 wa, 0.0 hi, 0.0 si, 0.0 st MiB Mem : 1829.0 total, 1426.5 free, 173.6 used, 228.9 buff/cache MiB Swap: 0.0 total, 0.0 free, 0.0 used. 1495.8 avail Mem PID USER PR NI VIRT RES SHR S %CPU %MEM TIME+ COMMAND 1 root 20 0 243968 13276 8908 S 0.0 0.7 0:01.86 systemd 2 root 20 0 0 0 0 S 0.0 0.0 0:00.00 kthreadd 3 root 0 -20 0 0 0 I 0.0 0.0 0:00.00 rcu_gp ...output omitted...
Useful Key Combinations to Sort FieldsRES
Use Shift+M to sort the processes based on resident memory.PID
Use Shift+N to sort the processes based on process ID.TIME+
Use Shift+T to sort the processes based on CPU time.
Press F and select a field from the list to use any other field for sorting.
IMPORTANT
The top command imposes a significant overhead on the system due to various system calls. While running the top command, the process running the top command is often the top CPU-consuming process.
Monitoring Memory Usage
The free command lists both free and used physical memory and swap memory. The -b, -k, -m, -g options show the output in bytes, KB, MB, or GB, respectively. The -s option is passed as an argument that specifies the number of seconds between refreshes. For example, free -s 1 produces an update every 1 second.
[user@host ~]$free -mtotal used free shared buff/cache available Mem: 1829 172 1427 16 228 1496 Swap: 0 0 0
The near zero values in the buff/cache and available columns indicate a low memory situation. If the available memory is more than 20% of the total, and the used memory is close to the total memory, then these values indicate a healthy system.
Monitoring File System Usage
One stable identifier that is associated with a file system is its UUID, a very long hexadecimal number that acts as a universally unique identifier. This UUID is part of the file system and remains the same as long as the file system is not recreated. The lsblk -fp command lists the full path of the device, along with the UUIDs and mount points, as well as the type of file system in the partition. If the file system is not mounted, the mount point displays as blank.
[user@host ~]$lsblk -fpNAME FSTYPE LABEL UUID MOUNTPOINT /dev/vda ├─/dev/vda1 xfs 23ea8803-a396-494a-8e95-1538a53b821c /boot ├─/dev/vda2 swap cdf61ded-534c-4bd6-b458-cab18b1a72ea [SWAP] └─/dev/vda3 xfs 44330f15-2f9d-4745-ae2e-20844f22762d / /dev/vdb └─/dev/vdb1 xfs 46f543fd-78c9-4526-a857-244811be2d88
The findmnt command allows the user to take a quick look at what is mounted where, and with which options. Executing the findmnt command without any options lists out all the mounted file systems in a tree layout. Use the -s option to read the file systems from the /etc/fstab file. Use the -S option to search the file systems by the source disk.
[user@host ~]$findmnt -S /dev/vda1TARGET SOURCE FSTYPE OPTIONS / /dev/vda1 xfs rw,relatime,seclabel,attr2,inode64,noquota
The df command provides information about the total usage of the file systems. The -h option transforms the output into a human-readable form.
[user@host ~]$df -hFilesystem Size Used Avail Use% Mounted on devtmpfs 892M 0 892M 0% /dev tmpfs 915M 0 915M 0% /dev/shm tmpfs 915M 17M 899M 2% /run tmpfs 915M 0 915M 0% /sys/fs/cgroup /dev/vda1 10G 1.5G 8.6G 15% / tmpfs 183M 0 183M 0% /run/user/1000
The du command displays the total size of all the files in a given directory and its subdirectories. The -s option suppresses the output of detailed information and displays only the total. Similar to the df -h command, the -h option displays the output into a human-readable form.
[user@host ~]$du -sh /home/user16K /home/user
Using GNOME System Monitor
The System Monitor available on the GNOME desktop provides statistical data about the system status, load, and processes, as well as the ability to manipulate those processes. Similar to other monitoring tools, such as the top, ps, and free commands, the System Monitor provides both the system-wide and per-process data. These monitoring tools retrieve commonly viewed information, and can be used by way of the command line or a graphical user interface, as determined by the system administrator. Use the gnome-system-monitor command to access the application from a command terminal.
To view the CPU usage, go to the Resources tab and look at the CPU History chart.
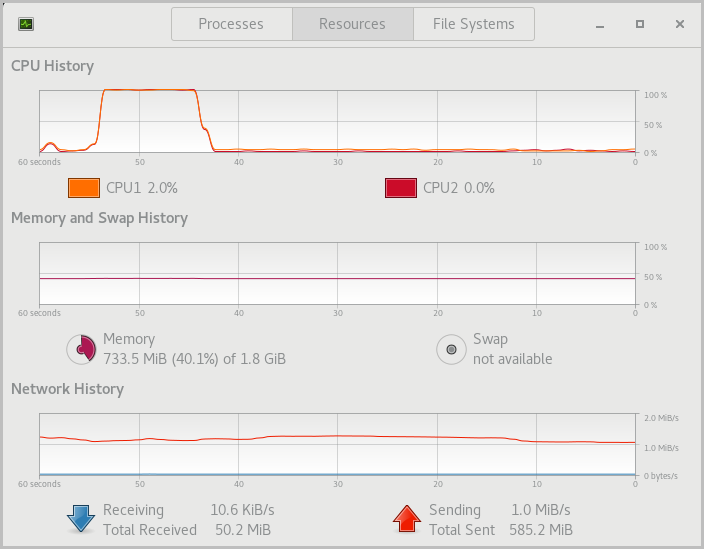 |
Figure 2.2: CPU usage history in System Monitor
The virtual memory is the sum of the physical memory and the swap space in a system. A running process maps the location in physical memory to files on disk. The memory map displays the total virtual memory consumed by a running process, which determines the memory cost of running that process instance. The memory map also displays the shared libraries used by the process.
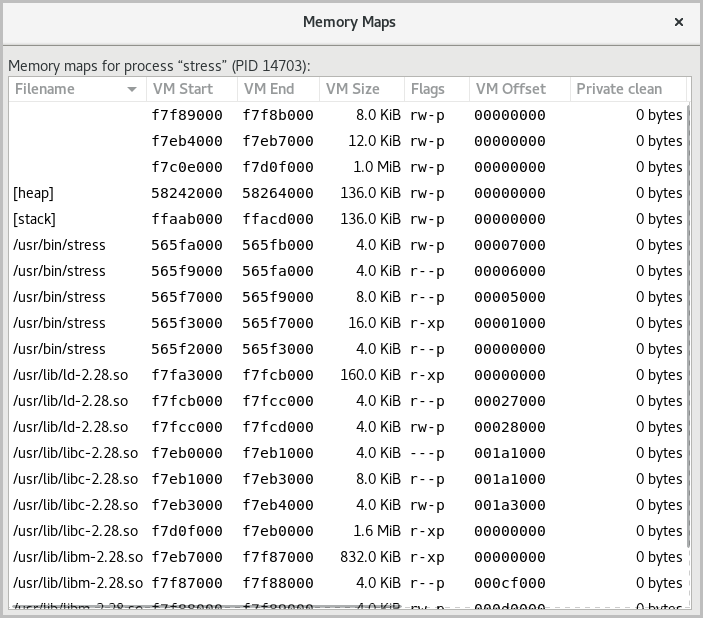 |
Figure 2.3: Memory map of a process in System Monitor
To display the memory map of a process in System Monitor, locate a process in the Processes tab, right-click a process in the list, and select Memory Maps.